 ΔTrace Labs
Educational research note
Crypto eras
In plain English · the 60-second version
What this is. A housekeeping note, not a trading finding. It chops crypto history (2015 to now) into 11 numbered chapters (E1 to E11) with no overlaps, so later research can use the same labels, such as "ETF era" or "Bust II".
Why it was needed. An earlier Bitcoin-vs-gold table mixed windows that overlapped (for example, the "ETF era" row sits inside the "Post-COVID" row). Rows that overlap are not independent samples, so you can't average them as if they were.
The numbers. The ρ (rho) values are correlations: +1 means two things move in lockstep, 0 means no relationship, −1 means opposite. For Bitcoin vs gold they are mostly close to 0 (−0.05 to 0.14), meaning "not much link". The one real episode is 2020: 0.45 in the five-week COVID crash and 0.33 across the full year. The latest 90-day reading (0.34) is a snapshot, not an era.
The takeaway. Bitcoin has not behaved like "digital gold" in most periods. In this study the link shows up in 2020 and nowhere else, and the latest 90-day reading is a snapshot rather than a new regime. The ρ figures are the published ones; nothing is recalculated here.
Bottom line: They split crypto history into 11 clean, non-overlapping eras so future studies can be compared fairly. The Bitcoin-gold link is weak most of the time, with 2020 the one real episode.
Jargon decoder
- Era (E1 to E11)
- A dated chapter of crypto history. Eras never overlap and together cover everything from 2015 to today.
- Overlay (G1 to G10)
- A window from the gold study. Overlays can overlap each other and the eras. Think of eras as chapters and overlays as highlighter marks over them.
- UTC, inclusive dates
- One global clock, and both the start and end days count. E2 ends 17 Dec 2017 and E3 starts 18 Dec, so there are no gaps.
- Pearson ρ (rho)
- A correlation from −1 to +1. Near 0 = unrelated, near +1 = move together, negative = move opposite. About 0.3 or above is a noticeable link.
- Cycle top / bottom
- The highest and lowest prices of a boom-bust cycle (Bitcoin: 19,799 top in 2017, 3,156 bottom in 2018, 126,200 top in Oct 2025).
- Live bear (E11)
- The current era: a downtrend that began after the October 2025 peak and hasn't ended, so it has no end date.
- Rolling 90-day (G10)
- A moving snapshot of the last 90 days, not a fixed era.
Summary
The BTC–gold regime table mixed three things: a baseline window, nested event tests, and a rolling snapshot. Those labels are now a calendar. Crypto eras are a UTC partition. Gold overlays keep the published Pearson numbers and are allowed to overlap.
Use the era IDs (E1–E11) to slice later notes. Do not average the gold-table rows as if they were eleven independent samples.
Key figures
How to read the old table
In plain English
The old table was mixing three different things: a baseline period, smaller events nested inside bigger periods (like the COVID crash inside "Full 2020"), and a moving snapshot. This note simply labels which is which.
Pre-COVID contains Cryptomania I and Bust I. Full 2020 contains the five-week COVID shock. ETF era sits inside Post-COVID (2023+). Rolling 90-day is the last 90 days of the gold sample, ending 30 Jun 2026.
Companion: Is Bitcoin digital gold?. Cycle extrema: 364 / 1064 clock.
Crypto eras (partition)
In plain English
Read the table top to bottom as a timeline: a quiet period (E1), the first boom and bust (E2, E3), a lull (E4), the COVID crash (E5), a second boom and bust that includes the FTX collapse (E7, E8), then the ETF era (E10) and today's downtrend (E11).
Inclusive UTC dates. Adjacent eras meet at midnight: E2 ends 17 Dec 2017, E3 starts 18 Dec 2017. Live bear (E11) has no end. Machine copy: crypto-eras.json.
Era timeline
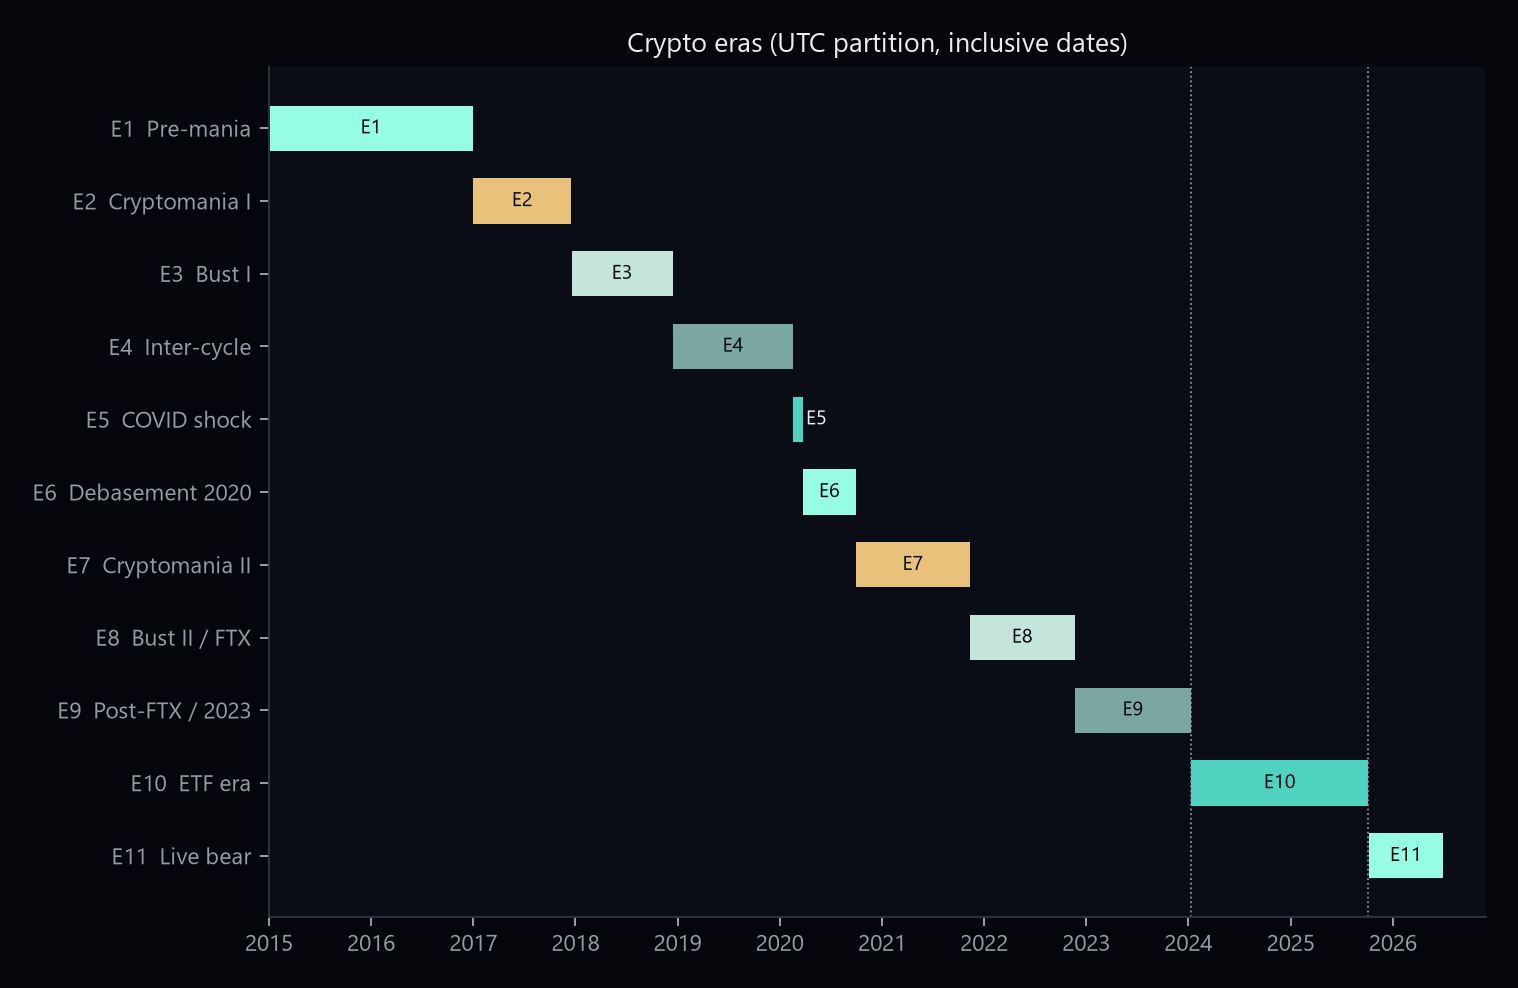
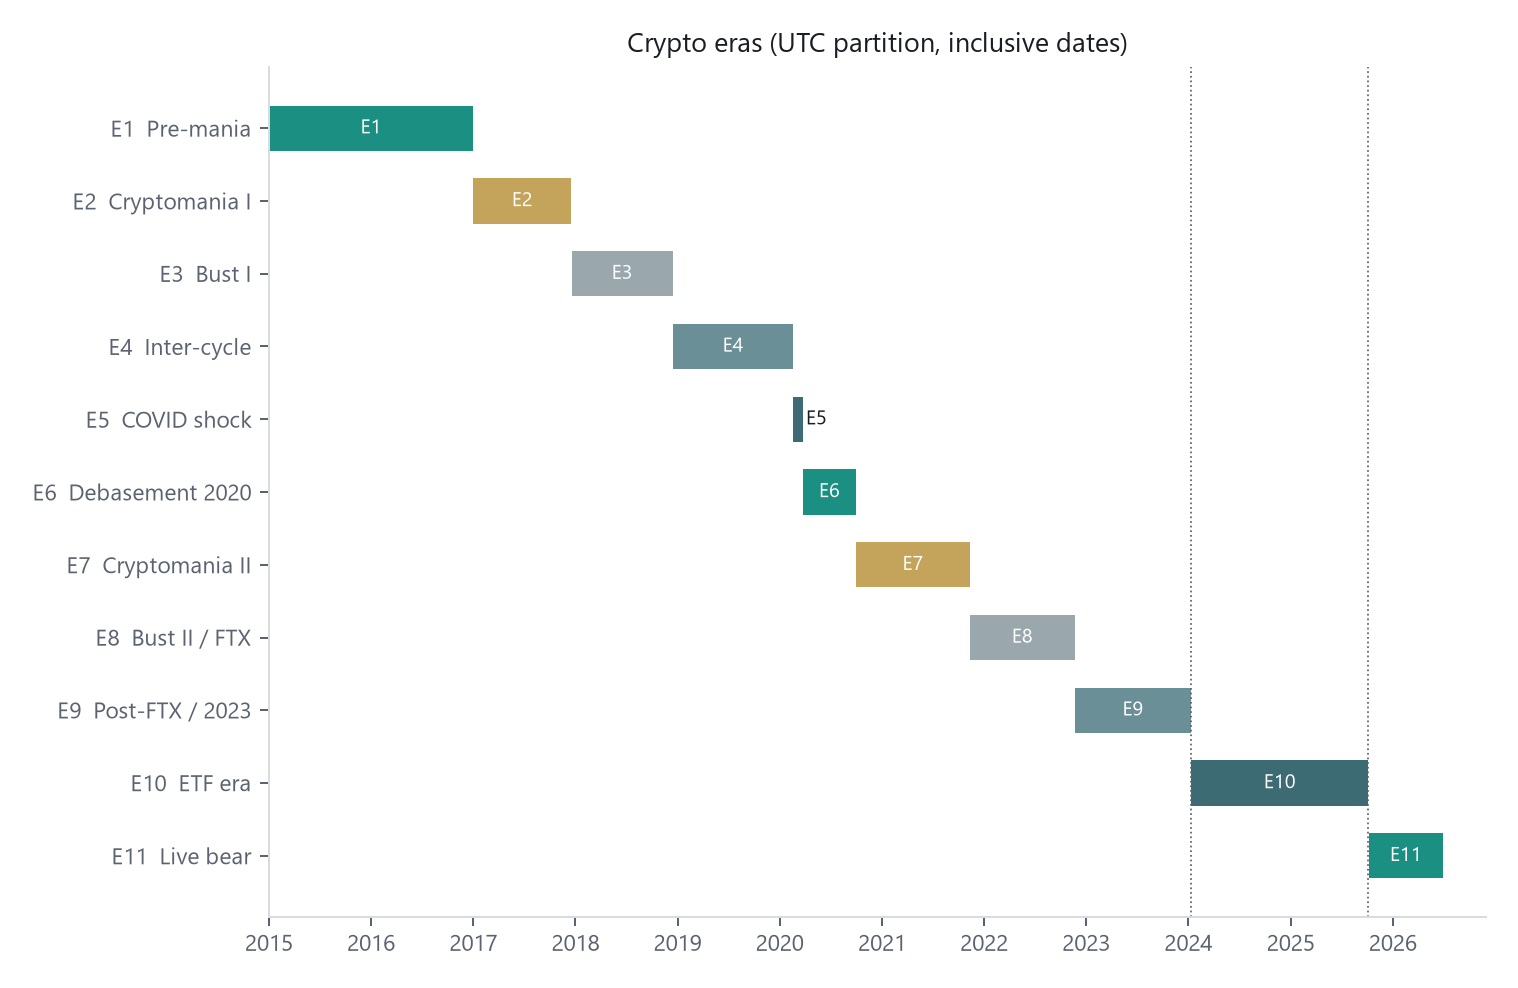
Dotted lines: US spot Bitcoin ETF first trade (11 Jan 2024) and the 6 Oct 2025 cycle top. Open era E11 is drawn through 30 Jun 2026, the gold-study as-of date.
| ID | Era | Start | End | Anchor |
|---|---|---|---|---|
| E1 | Pre-mania | 2015-01-01 | 2016-12-31 | Quiet years before the first blow-off |
| E2 | Cryptomania I | 2017-01-01 | 2017-12-17 | Cycle top 19,799 |
| E3 | Bust I | 2017-12-18 | 2018-12-15 | Cycle bottom 3,156 |
| E4 | Inter-cycle | 2018-12-16 | 2020-02-18 | After 2018 low, before COVID tape |
| E5 | COVID shock | 2020-02-19 | 2020-03-23 | Five weeks, equity peak to crash low |
| E6 | Debasement 2020 | 2020-03-24 | 2020-09-30 | Post-crash 2020; gold’s August high |
| E7 | Cryptomania II | 2020-10-01 | 2021-11-10 | Q4 2020 through cycle top 69,000 |
| E8 | Bust II / FTX | 2021-11-11 | 2022-11-21 | FTX 11 Nov 2022 sits inside this bear |
| E9 | Post-FTX / 2023 | 2022-11-22 | 2024-01-10 | After 2022 low, before ETF trading |
| E10 | ETF era | 2024-01-11 | 2025-10-06 | First trade through cycle top 126,200 |
| E11 | Live bear | 2025-10-07 | open | Model mark 5 Oct 2026 |
Gold overlays (published ρ)
In plain English
The ρ column is how closely Bitcoin moved with gold in each window. Most rows sit near 0 (no real link). The standouts are in 2020: the COVID crash (0.454), when nearly everything sold off together, and the full year (0.331). The latest 90 days (0.341) is a snapshot, not an era, so it is shown for reference rather than as a new regime.
These windows produced the BTC–gold Pearson table. They overlap. ρ is not recomputed here.
| ID | Label | Start | End | ρ | Covers |
|---|---|---|---|---|---|
| G1 | Pre-COVID (2015–19) | 2015-01-01 | 2019-12-31 | 0.035 | E1–E4 |
| G2 | Cryptomania I (2017–18) | 2017-01-01 | 2018-12-31 | 0.031 | E2–E3 |
| G3 | Bust I (2018) | 2018-01-01 | 2018-12-31 | −0.045 | E3 |
| G4 | COVID shock (5 weeks) | 2020-02-19 | 2020-03-23 | 0.454 | E5 |
| G5 | Full 2020 | 2020-01-01 | 2020-12-31 | 0.331 | E5–E7 |
| G6 | Cryptomania II (2020–21) | 2020-10-01 | 2021-12-31 | 0.008 | E7 |
| G7 | Bust II / FTX year | 2022-01-01 | 2022-12-31 | 0.071 | E8 |
| G8 | Post-COVID (2023+) | 2023-01-01 | 2026-06-30 | 0.142 | E9–E11 |
| G9 | ETF era (2024+) | 2024-01-01 | 2026-06-30 | 0.144 | E10–E11 |
| G10 | Rolling 90-day | 2026-04-02 | 2026-06-30 | 0.341 | E11 snapshot |
G6 is pinned to Q4 2020 through 2021 so it does not swallow G5. G9 uses calendar 2024+ as in the gold study; the partition starts 11 Jan 2024.
Caveats
In plain English
An era is a convenient label, not a prediction of how markets will behave. The gold numbers haven't been recomputed on the new eras yet, and nothing here is investment advice.
Notes are educational. They are not investment advice and they do not recommend trades. Historical or simulated results are not a live track record.
An era is a dating convention, not a trading regime. Cycle prices are Binance daily wicks. COVID bounds follow the US equity peak (19 Feb 2020) and March 2020 crash low (23 Mar 2020), matching the original “five weeks.” Gold ρ stay on the overlay windows until that study is rerun on E1–E11.
Disclaimer
- ΔTrace Labs is a personal portfolio and research project, not a registered fund, asset manager, broker, exchange, advisory business or licensed virtual-asset service provider.
- It does not manage external capital, accept deposits, provide investment advice, sell signals or offer client trading services.
- Named platforms and evaluation programmes, including Propr, Hyperliquid, Lucid Trading and Tradeify, are not employers or formal affiliates.
- Research on this site is educational and is not a recommendation to buy, sell or hold any instrument. Historical or simulated results are not a live track record.
- No returns, assets under management, clients, partnerships, testimonials or performance figures are claimed unless they can be evidenced. Published indicators are listed only when a public URL exists.