 ΔTrace Labs
Educational research note
Is Bitcoin digital gold?
In plain English · the 60-second version
The question. Is Bitcoin 'digital gold'? Does it move with gold, or protect you when markets fall?
The result. No. The median 90-day correlation with gold is 0.07; the bar for 'yes' was set at 0.15 in advance. During both manias and both busts the link was zero.
Caveats. The one real link was the COVID crash (0.45), when everything was sold for cash, plus the 2020 money-printing rally (0.33), which faded. The latest 90-day reading (0.34) is the highest since 2020 and may or may not last. After removing the effect of US stocks and the dollar, the BTC–gold link falls to 0.065, and on Bitcoin's worst days gold tended to fall too.
Scope. The test was pre-registered: a pass/fail rule set before looking at results, then applied as written. Based on a QuantConnect study of daily returns, Jan 2015 to Jun 2026.
Bottom line: Bitcoin hasn't behaved like digital gold. It moves more like tech stocks, and gold hasn't protected you when Bitcoin crashed.
Jargon decoder
- Correlation (Pearson ρ)
- −1 to +1: how closely two things move together. 0 = unrelated, +1 = lockstep, negative = opposite. Under about 0.2 is weak; above about 0.5 is strong.
- Rolling 90-day
- A correlation recomputed over a moving 90-day window, to see how the relationship changes over time.
- Pre-registered
- Test and pass/fail rules written down before looking at results, so they can't be tweaked afterwards.
- z-score
- How many standard errors a result sits from zero. Around 2 or above (here 2.48) means it is unlikely to be chance; it doesn't say how large or useful the effect is.
- QQQ / UUP
- QQQ is a Nasdaq-100 tech-stock ETF. UUP is an ETF that tracks the US dollar.
- Co-crash
- Both assets falling at once, usually because investors sell everything for cash.
Summary
On 3,568 UTC daily log returns (Jan 2015 – Jun 2026), Bitcoin is not digital gold. Median rolling 90-day Pearson versus gold is 0.072. Across both cryptomanias and both busts the daily link was indistinguishable from zero.
The one real episode is co-crash, not haven: COVID shock ρ = 0.454. The current 90-day print (0.341) is the highest since 2020. It is worth watching. It is not eleven years of evidence for the usual claim. Dated windows and the reusable era calendar are in Crypto eras.
Key figures
Pre-registered tests
In plain English
T1 is the key one: 'digital gold' was declared dead if the median correlation was under 0.15, and it was 0.07. T2: the link did rise (0.035 to 0.144, statistically real), but it started in 2023, not at the Bitcoin ETF launch. T3: a 50/50 Bitcoin–gold mix cut drawdowns simply because gold is steadier, not because it hedges.
T1 “Digital gold” — killed. Kill threshold was median 90-day ρ of 0.15. Observed median 0.072. Manias and busts, the periods where lockstep is predicted, printed zeros.
T2 Regime shift — statistically real, ETF timing is not. Pre-COVID 0.035 to ETF-era 0.144 is significant (z = 2.48, p = 0.013). 2023 alone is already 0.142. The break sits in 2023 (post-banking-crisis / deficit-macro), not at ETF launch.
T3 Portfolio mix — arithmetic, not hedging. A 50/50 mix cut BTC’s 2018 max drawdown from 167% to 87% and 2022 from 110% to 61% at ρ ≈ 0.1. That is volatility dilution.
Evidence
In plain English
ρ near 0 means no relationship. Rows overlap (G2 sits inside G1, G4 inside G5), so they are not independent samples. Only the COVID crash and 2020 stand out; the rest are close to zero.
Regime Pearson
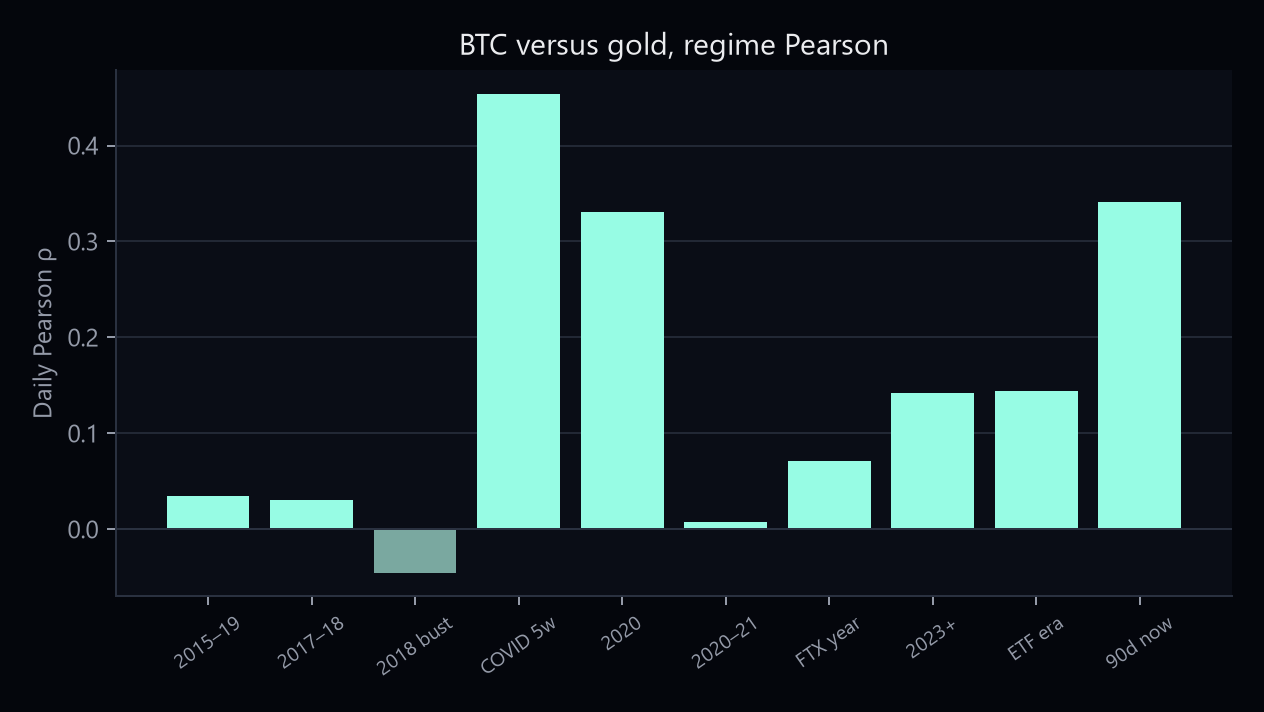
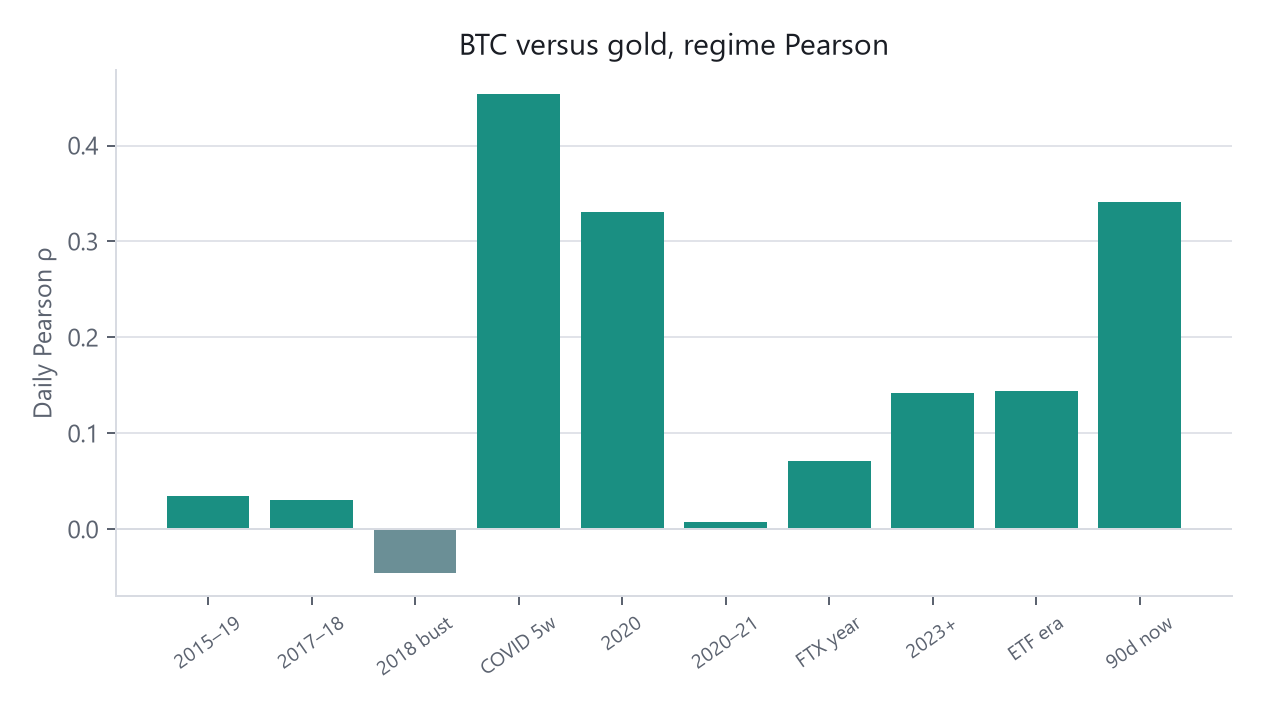
Clock-aligned UTC daily log returns from hourly bars on both assets. QuantConnect research notebook, 3,568 observations. These rows overlap; they are gold overlays (G1–G10), not the E1–E11 partition.
| ID | Regime | Start | End | ρ | Read |
|---|---|---|---|---|---|
| G1 | Pre-COVID (2015–19) | 2015-01-01 | 2019-12-31 | 0.035 | Statistically zero |
| G2 | Cryptomania I (2017–18) | 2017-01-01 | 2018-12-31 | 0.031 | Zero |
| G3 | Bust I (2018) | 2018-01-01 | 2018-12-31 | −0.045 | Zero |
| G4 | COVID shock (5 weeks) | 2020-02-19 | 2020-03-23 | 0.454 | Co-crash |
| G5 | Full 2020 | 2020-01-01 | 2020-12-31 | 0.331 | Shared debasement bid |
| G6 | Cryptomania II (2020–21) | 2020-10-01 | 2021-12-31 | 0.008 | Zero |
| G7 | Bust II / FTX year | 2022-01-01 | 2022-12-31 | 0.071 | Zero |
| G8 | Post-COVID (2023+) | 2023-01-01 | 2026-06-30 | 0.142 | Modest lift |
| G9 | ETF era (2024+) | 2024-01-01 | 2026-06-30 | 0.144 | Same as 2023 |
| G10 | Rolling 90-day (as of study) | 2026-04-02 | 2026-06-30 | 0.341 | Highest since 2020 |
G2–G3 sit inside G1. G4 sits inside G5. G9 sits inside G8. G10 is a snapshot, not an era. Reuse E1–E11 when slicing a new tape.
Period by period
2015–2019. ρ ≈ 0.03 to −0.05. When BTC ran from roughly $1,000 to $20,000 in 2017 and then lost about 84% in 2018, gold did nothing in particular either time. If the correlation was “felt” in those years, it was the shared narrative, not co-movement in returns.
COVID shock, Feb–Mar 2020. ρ = 0.45, the sample maximum — and it is co-crash. BTC fell about 50% and gold fell with it (about 12% over the same weeks). Both were sold for dollar liquidity.
Full 2020 (ρ = 0.33). The one real episode, and it is a shared cause, not a shared asset. The Fed collapsed real rates and the dollar slid; both assets got the same debasement bid. It fully mean-reverted: 2021 printed −0.03.
Cryptomania II and the FTX bust. ρ = 0.008 through the second mania; 0.071 through 2022. Gold sold off as real rates rose; BTC sold off on leverage unwind and exchange collapse.
2023 to the sample end. The link roughly quadrupled versus the 2015–19 baseline (p = 0.013), but 2023 alone already prints 0.142 — identical to the ETF-era 0.144. The current rolling 90-day reading of 0.34 is the strongest outside 2020. 2020’s spike fully unwound.
Identity on this sample
In plain English
Once stocks and the dollar are stripped out, the Bitcoin–gold link is only 0.065. Bitcoin is about 2.6x more tied to Nasdaq tech stocks (0.25). Gold's real link is to the dollar (−0.36: it rises when the dollar falls). On Bitcoin's worst days gold fell too (+0.46), so it was no haven.
| Pair | Daily ρ | Read |
|---|---|---|
| BTC vs gold, residual after QQQ and UUP | 0.065 | Unrelated once factors are stripped |
| BTC vs QQQ | 0.249 | About 2.6× the gold link |
| Gold vs UUP | −0.36 | Gold’s identity here is anti-dollar |
| BTC vs UUP | −0.06 | No dollar link |
| BTC vs gold on BTC days < −2σ | +0.46 | Gold tended to fall with it |
Control for equities and the dollar and the direct BTC–gold link collapses to 0.065. On Bitcoin days worse than −2 standard deviations, gold is not a haven. March 2020 is the archetype, not an exception.
Caveats
Notes are educational. They are not investment advice and they do not recommend trades. Historical or simulated results are not a live track record.
Returns, not drifting price charts. A 50/50 drawdown cut is mix arithmetic. The 2025–26 rolling print can unwind, as 2020 did. This note restates a QuantConnect study (hourly bars → UTC daily log returns), not Binance Vision klines.
Disclaimer
- ΔTrace Labs is a personal portfolio and research project, not a registered fund, asset manager, broker, exchange, advisory business or licensed virtual-asset service provider.
- It does not manage external capital, accept deposits, provide investment advice, sell signals or offer client trading services.
- Named platforms and evaluation programmes, including Propr, Hyperliquid, Lucid Trading and Tradeify, are not employers or formal affiliates.
- Research on this site is educational and is not a recommendation to buy, sell or hold any instrument. Historical or simulated results are not a live track record.
- No returns, assets under management, clients, partnerships, testimonials or performance figures are claimed unless they can be evidenced. Published indicators are listed only when a public URL exists.