 ΔTrace Labs
Educational research note
Does Bitcoin’s 364 / 1064-day clock still hold?
In plain English · the 60-second version
The question. People claim Bitcoin runs on a clock: the bottom comes 364 days after the peak, and the next peak about 1,064 days after that bottom. Does it hold?
The result. On the two completed cycles, yes, all four legs match within 14 days. The latest peak was 6 Oct 2025 at 126,200, putting the 'model bottom' at 5 Oct 2026. As of the note's date (17 Sep 2026) price was down as far as 54% (low of 57,800 on 1 Jul 2026), with 18 days to go.
Caveats. Only two cycles have completed, and 364 and 1,064 were chosen after seeing them (four data points behind two fitted numbers), so a close fit is expected and the live cycle is the real test. This cycle's drop so far (−54%) is also shallower than 2018 (−84%) or 2022 (−78%).
Scope. A historical timing observation on Binance daily wicks, not a forecast or a trade.
Bottom line: There's a popular four-year Bitcoin clock. Two past cycles fit it, but with just two examples and the numbers chosen in hindsight, the current cycle is the only real test.
Jargon decoder
- Wick / daily high-low
- The highest and lowest prices touched during a day, not just where it closed.
- Drawdown
- How far price has fallen from its peak. −54% = down 54% from the high.
- ATH
- All-time high.
- Halving
- A scheduled cut in new Bitcoin issuance, roughly every four years (latest: April 2024).
- Correlation (Pearson ρ)
- −1 to +1: how closely two things move together. 0 = unrelated, +1 = lockstep, negative = opposite. Under about 0.2 is weak; above about 0.5 is strong.
- Beta
- How big one coin's moves are versus another's. Beta 1.3 vs BTC = it moves about 30% more than Bitcoin.
Summary
On Binance BTCUSDT daily wicks, the two completed major cycles match a 364-day bear / 1,064-day bull calendar to within two weeks. That is a historical timing fact on this tape, not a forecast and not a trade.
The live test is the 6 Oct 2025 high at 126,200. As of 17 Sep 2026 that high is 346 days old, 54.2% off the wick high, with the running low on 1 Jul 2026 at 57,800. The 364-day mark is 5 Oct 2026 — 18 days from the as-of date. That date is not a confirmed bottom. n is still two completed cycles.
Key figures
The claim
The circulating 364 / 1064 thesis, restated from the last high, is: 364 days after a major cycle all-time high is the bottom; about 1,064 days after that bottom is the next all-time high. The same rhythm is roughly three years up and one year down. It is a calendar hypothesis, not a price target.
Public commentary dates the last high to 6 Oct 2025 (~$126,198) and therefore the model bottom to 5 Oct 2026. This note rebuilds those dates from SHA-256 verified Binance Vision daily klines, with a Binance API tail for 1–17 Sep 2026. No tick tape is used.
How a cycle top is defined
In plain English
To avoid cherry-picking, the rule was fixed first: a top is a record high not beaten for 180 days that is followed by a drop of at least 50%. April 2021 also met that rule but was beaten within a year, so it counts as a mid-cycle dump, not a cycle top.
Pre-registered, before looking at errors: a candidate top is a record high that is not taken out for 180 days and is followed by a drawdown of at least 50%, using daily high/low (wicks). That rule also flags the April 2021 crash (55.6% drawdown, taken out 189 days later). That is a mid-cycle dump, not a four-year turn.
Headline results therefore use major cycle tops: the 180-day / 50% test, plus the high is not taken out for 365 days, or it is still standing. April 2021 drops. December 2017, November 2021 and October 2025 remain. Sensitivity is in the appendix.
Evidence
Cycle tops, bottoms, and the 364-day clock
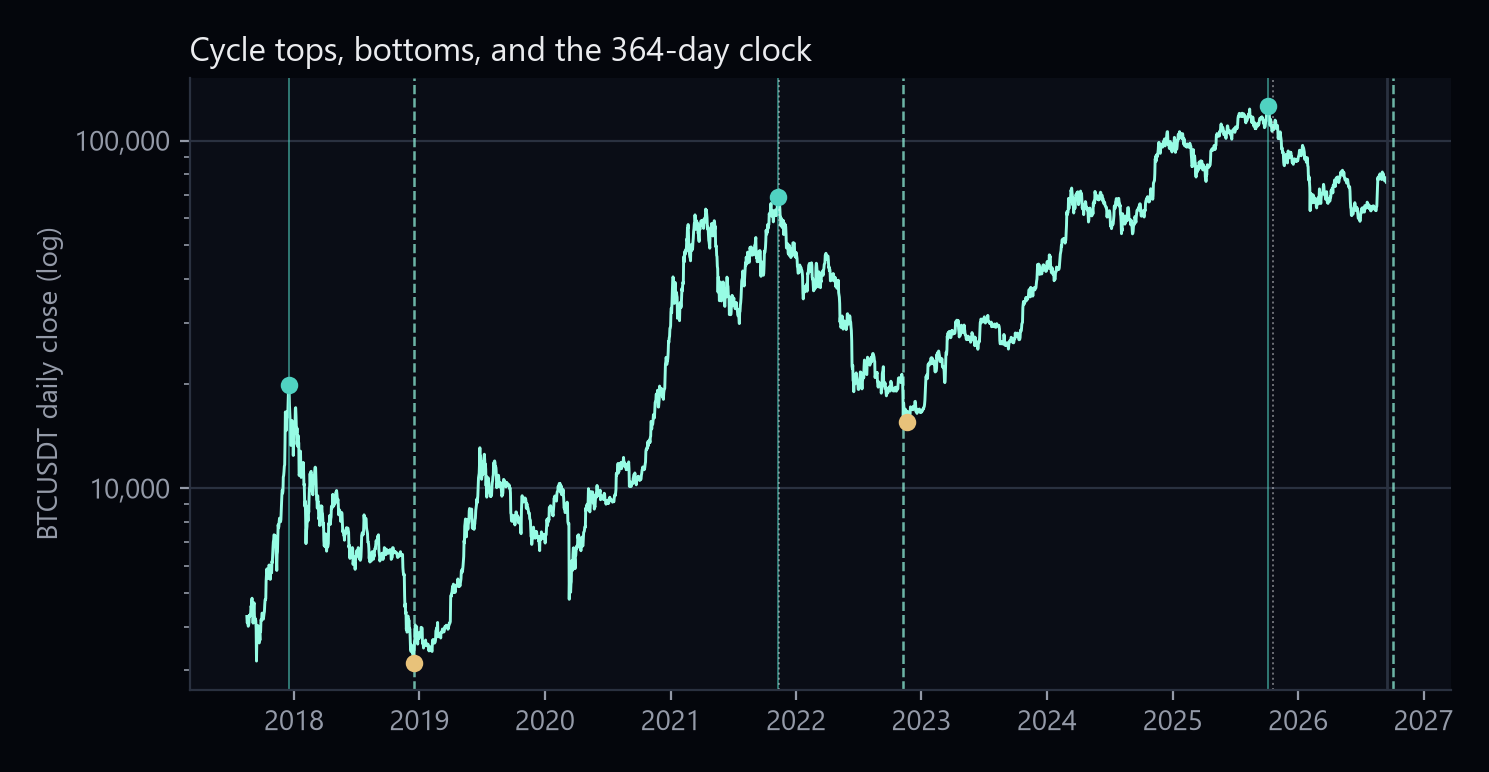
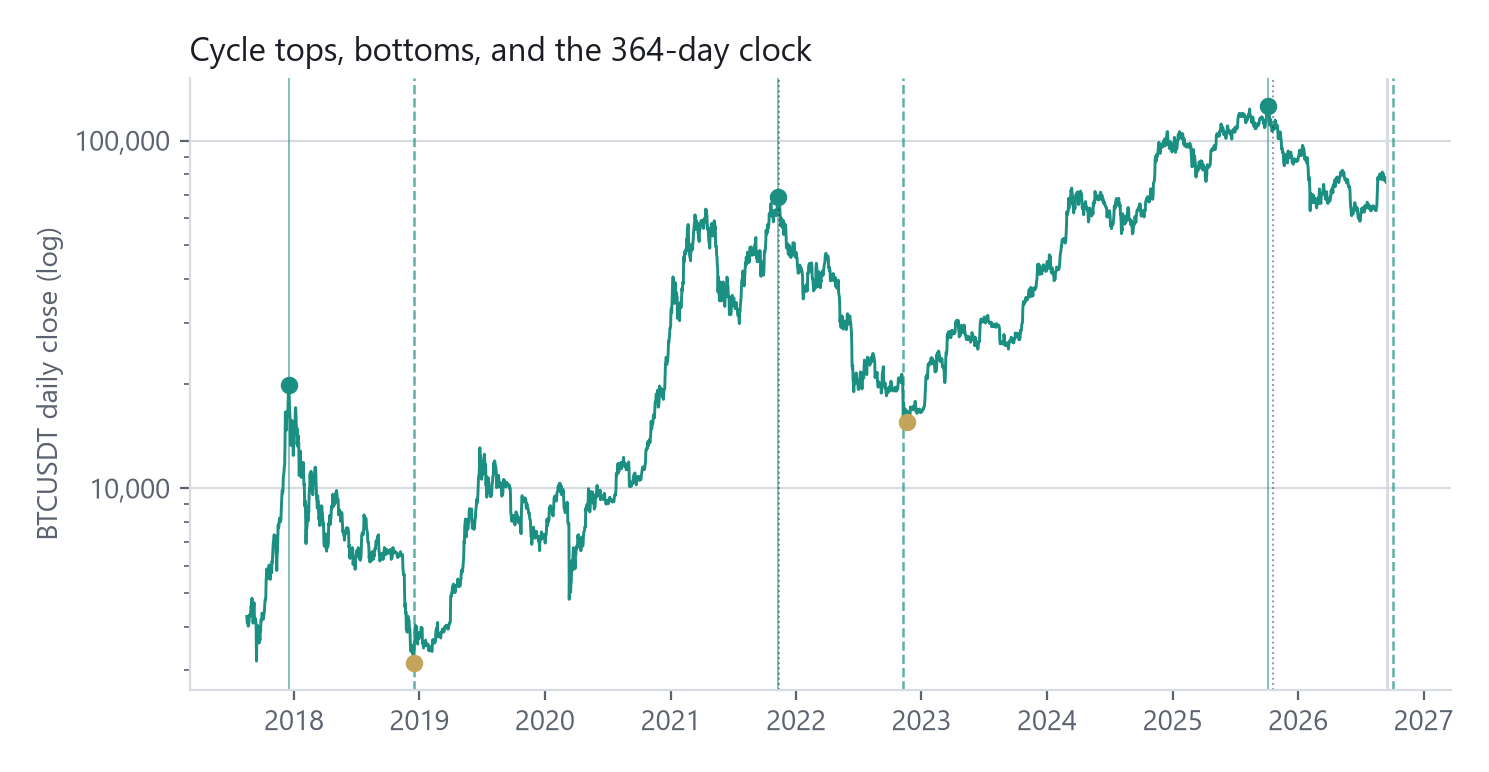
Teal markers: major cycle tops. Pale markers: confirmed bottoms. Mint dashed: top + 364 days. Dotted: bottom + 1,064 days. Source: Binance BTCUSDT daily closes; extrema from daily wicks.
| Leg | From | To | Actual | Model | Error |
|---|---|---|---|---|---|
| Bear | 17 Dec 2017 · 19,799 | 15 Dec 2018 · 3,156 | 363 | 364 | −1 |
| Bull | 15 Dec 2018 · 3,156 | 10 Nov 2021 · 69,000 | 1,061 | 1,064 | −3 |
| Bear | 10 Nov 2021 · 69,000 | 21 Nov 2022 · 15,476 | 376 | 364 | +12 |
| Bull | 21 Nov 2022 · 15,476 | 6 Oct 2025 · 126,200 | 1,050 | 1,064 | −14 |
Prices are Binance daily wicks. Error is actual minus model. Two completed bears, two completed bulls.
Timing error versus 364 / 1064
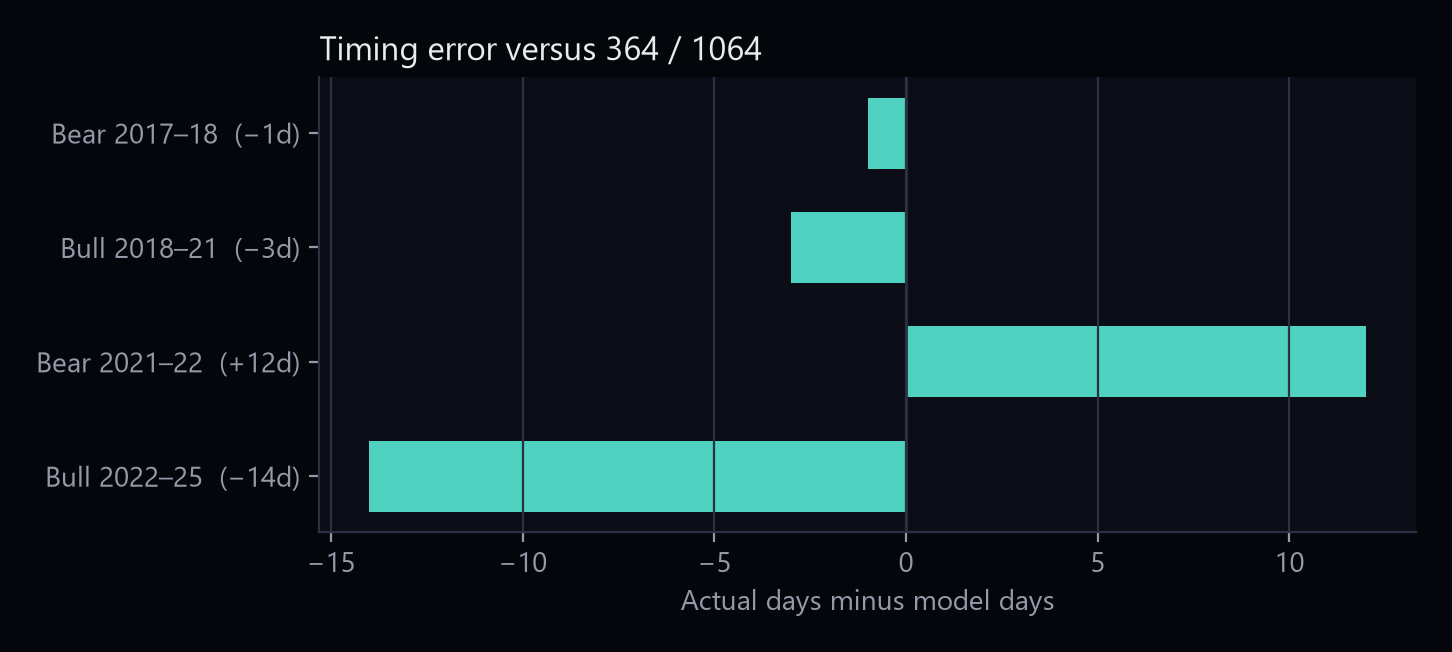
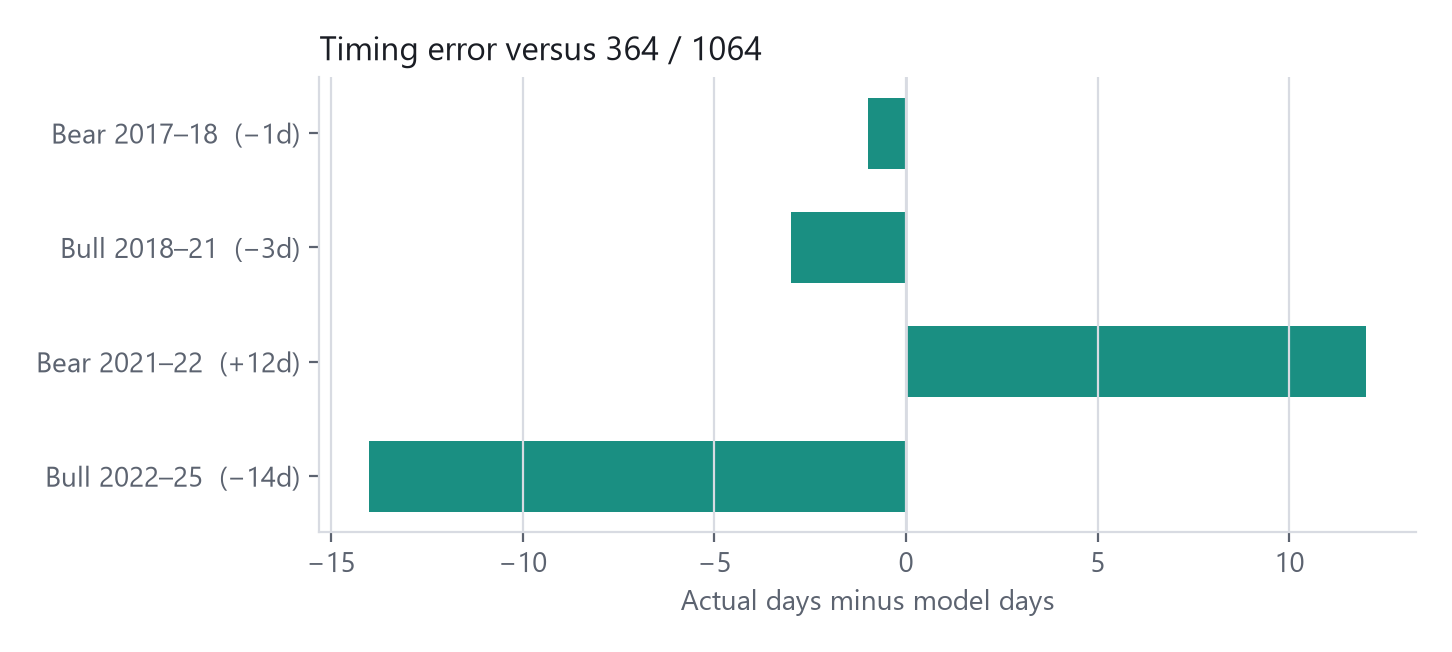
Largest miss in this sample is the last bull, 14 days early. Nothing here is a month off. Four numbers were available to pick 364 and 1,064 after the fact. The only out-of-sample test is the live window.
Live status
In plain English
The July low of 57,800 is only the lowest price so far, not a confirmed bottom. What would count against the clock: a new all-time high before a bottom, or a bottom that is already in and far from Oct–Dec 2026.
Drawdown from the 6 Oct 2025 wick high
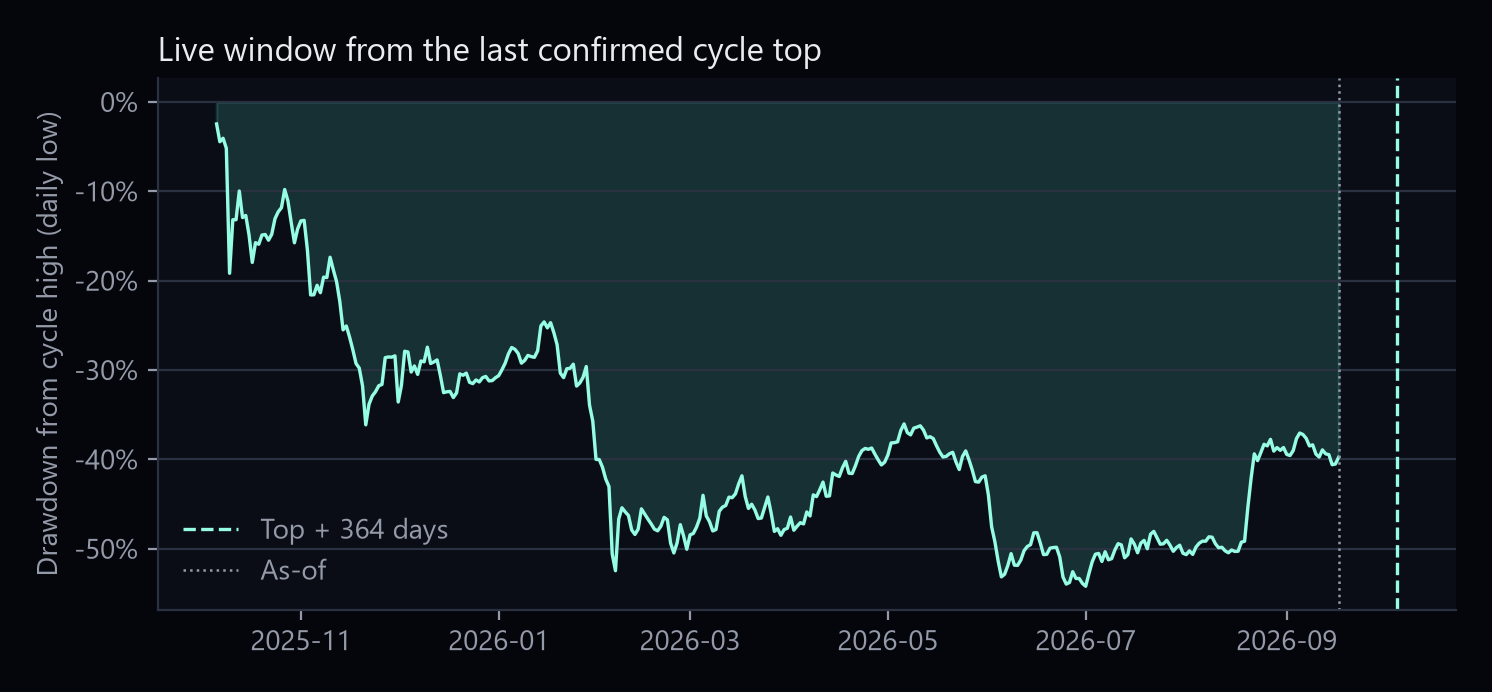
Drawdown from the 6 Oct 2025 wick high using daily lows. Mint dashed line is 5 Oct 2026. As-of 17 Sep 2026.
| Item | Value |
|---|---|
| Last major cycle high | 6 Oct 2025 · 126,200 |
| Days since that high | 346 |
| Running low (not a confirmed bottom) | 1 Jul 2026 · 57,800 · −54.2% |
| Model mark | 5 Oct 2026 |
| Days remaining to model mark | 18 |
| New all-time high since Oct 2025? | No |
| If 5 Oct 2026 were the low, next ATH by the same clock | ≈ 3 Sep 2029 (low + 1,064) |
The July low is the deepest print so far. It is not a confirmed cycle bottom until a new all-time high or a low that holds through the window.
A new all-time high before a confirmed cycle low would mean October 2025 was not the cycle top. A major low already in that holds far from October–December 2026 would weaken the 364-day bear leg this time. No major low until 2027, or a grind that never makes a cycle low, would fail this iteration of the clock. n remains 2 either way.
Halving alignment
In plain English
Both recent tops came about 18 months after a Bitcoin halving, so the 364/1064 clock and the halving cycle may be the same pattern counted twice rather than two pieces of evidence.
| Cycle top | Prior halving | Days after halving |
|---|---|---|
| 17 Dec 2017 | Pre-sample (Jul 2016) | n/a on Binance |
| 10 Nov 2021 | 11 May 2020 | 548 |
| 6 Oct 2025 | 20 Apr 2024 | 534 |
The last two tops both sit about 18 months after a halving. The 364/1064 clock and the halving clock are not independent stories. Next halving is ~15 Apr 2028; 534–548 days after that is Oct–Nov 2029, close to the 1,064-day projection of Sep 2029.
Weekend liquidity by phase
In plain English
This repeats the weekend-volume finding from the other notes, split by cycle phase: weekends have been getting thinner across cycles, in bulls and bears alike.
Using the same BTCUSDT base-asset volume as the weekday study, weekends are not uniformly thin in bears. The gap has widened across cycles.
Weekend / weekday mean BTC volume
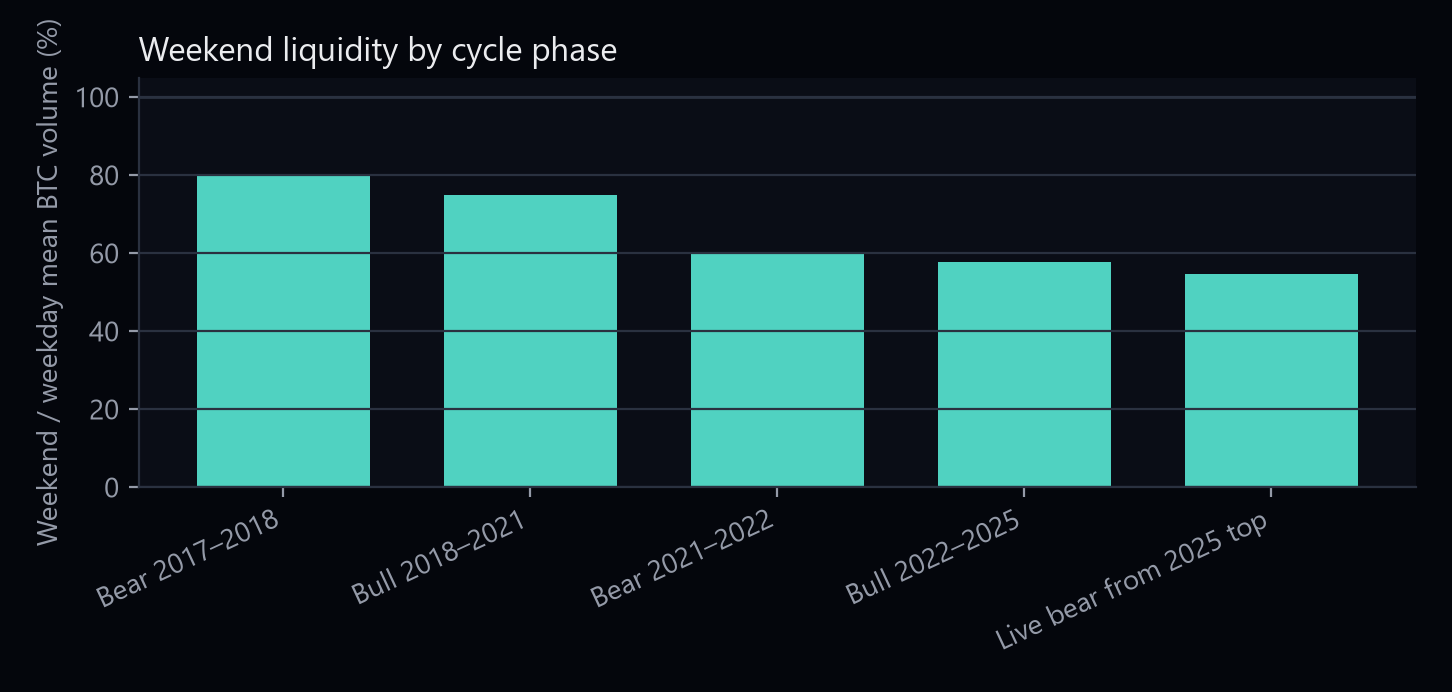
Weekend mean BTC volume as a percent of weekday mean, inside each major-cycle window.
| Phase | Days | Weekend / weekday | Shortfall |
|---|---|---|---|
| Bear 2017–2018 | 364 | 80.0% | 20.0% |
| Bull 2018–2021 | 1,062 | 74.9% | 25.1% |
| Bear 2021–2022 | 377 | 59.8% | 40.2% |
| Bull 2022–2025 | 1,051 | 57.8% | 42.2% |
| Live window from Oct 2025 | 347 | 54.6% | 45.4% |
| Full sample | 3,319 | 65.4% | 34.6% |
The weekend gap has widened across cycles. It is not a clean bear-versus-bull effect: the 2022–25 bull was already thin on weekends. The live window is the lowest print in the sample.
ETH, SOL, XRP by phase
In plain English
Other coins move more with Bitcoin in bear phases (correlation 0.87–0.91 in the current one), so they offer little protection when BTC falls. Beta of about 1.3 means they swing about 30% more than BTC. 'Path excess −29%' means SOL finished about 29% worse than BTC over the window.
Daily log-return Pearson versus BTC, OLS beta, and total excess versus BTC (exp(sum(r_alt − r_btc)) − 1). SOL is omitted from 2017–18 (not listed). TAO and HYPE are cut from these tables. Path totals describe the coins on this venue; they are not a ΔTrace Labs track record.
Pearson versus BTC by cycle phase
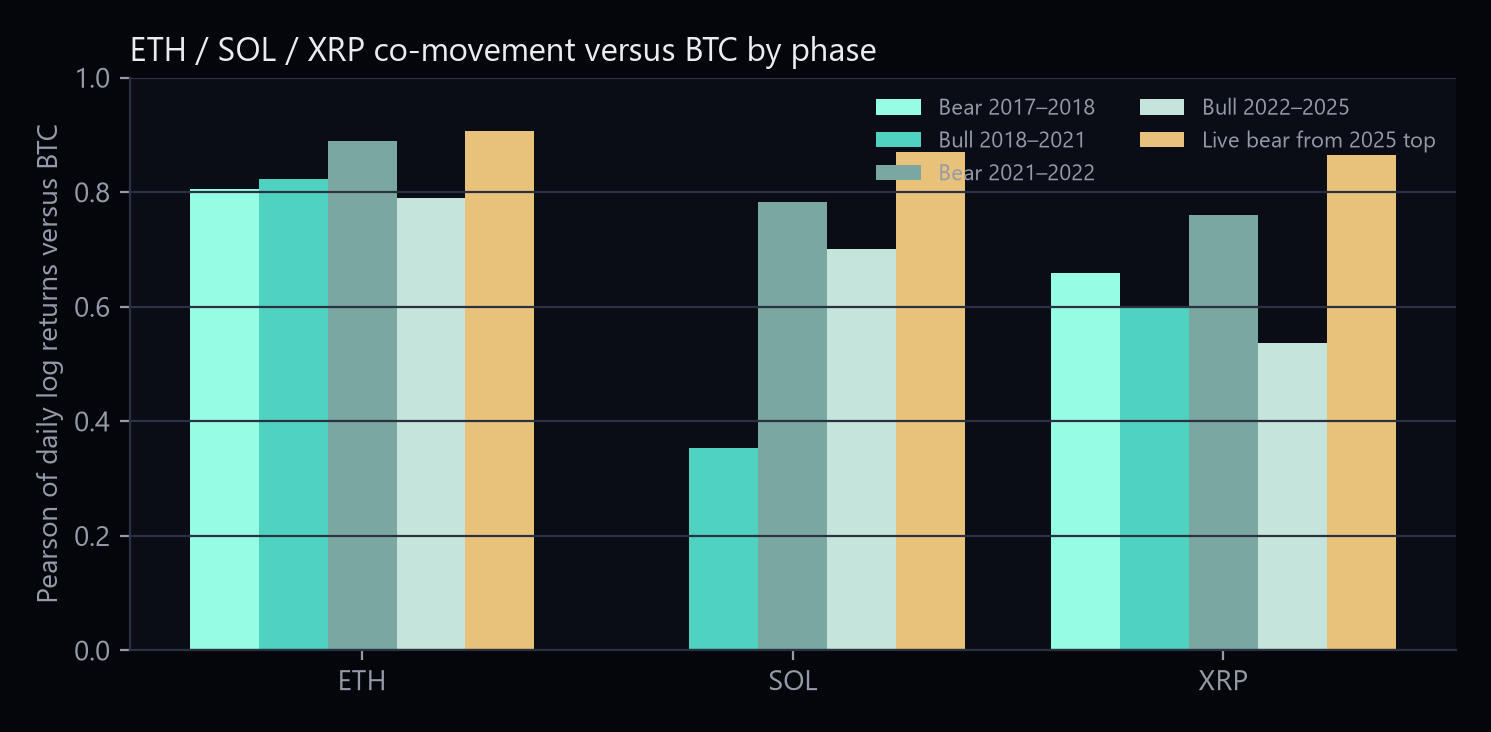
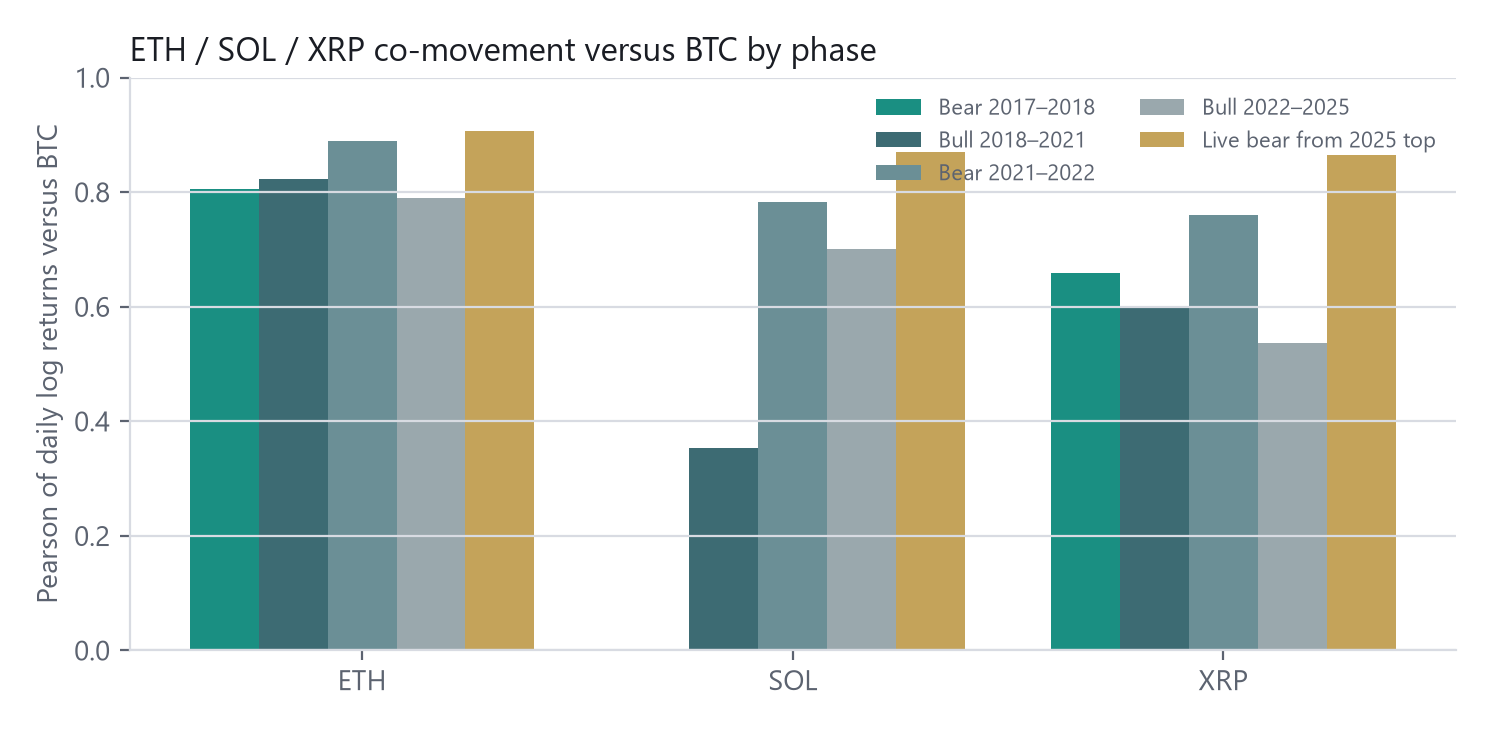
Pearson of overlapping daily log returns versus BTC in each major-cycle window.
| Phase | ETH ρ | SOL ρ | XRP ρ |
|---|---|---|---|
| Bear 2017–2018 | 0.81 | n/a | 0.66 |
| Bull 2018–2021 | 0.82 | 0.35 | 0.60 |
| Bear 2021–2022 | 0.89 | 0.78 | 0.76 |
| Bull 2022–2025 | 0.79 | 0.70 | 0.54 |
| Live window | 0.91 | 0.87 | 0.87 |
Bears tighten the cluster. The live window is the tightest ETH/SOL/XRP tape in the sample. The last bull was the loosest for XRP (0.54).
| Live window vs BTC | Pearson | Beta | Path excess vs BTC |
|---|---|---|---|
| ETH | 0.91 | 1.30 | −12.8% |
| SOL | 0.87 | 1.31 | −29.3% |
| XRP | 0.87 | 1.29 | −29.4% |
6 Oct 2025 – 17 Sep 2026. BTC path total on closes −38.2%. ETH, SOL and XRP lagged Bitcoin on this tape; they did not offset it.
Young coins, appendix only
TAO spot from 11 Apr 2024 and HYPE USD-M futures from 30 May 2025 cannot see 2018 or 2022. They do not enter any pooled statistic.
| Window | TAO ρ vs BTC | HYPE ρ vs BTC | HYPE path excess vs BTC |
|---|---|---|---|
| Last bull (from listing) | 0.67 (n=543) | 0.64 (n=129) | +20% |
| Live window | 0.61 (n=347) | 0.51 (n=347) | +168% |
HYPE here is Binance USD-M perpetual klines, not an evaluation venue. The sample is short. In the live window it did not track BTC (0.51). That is a different name, not a cycle fact about majors.
Sensitivity
In plain English
Changing the rules (210 days, close instead of wick) keeps the same tops, but a stricter −70% drawdown rule would not yet count the 2025 top, which is why the live cycle is still unconfirmed.
| Rule | Tops kept |
|---|---|
| Wick, 180d, 50% drawdown (raw) | Dec 2017; Apr 2021; Nov 2021; Oct 2025 |
| Headline: + not taken out 365d | Dec 2017; Nov 2021; Oct 2025 |
| Wick, 210d, 50% drawdown | Dec 2017; Nov 2021; Oct 2025 |
| Wick, 180d, 70% drawdown | Dec 2017; Nov 2021 (Oct 2025 not yet −70%) |
| Close instead of wick | Same four raw dates, ±2 days |
The April 2021 peak fails a 365-day unbroken test (taken out after 189 days). A 70% drawdown rule would not yet confirm October 2025.
Caveats
Notes are educational. They are not investment advice and they do not recommend trades. Historical or simulated results are not a live track record.
Two completed cycles is not a law. 364 and 1,064 were available to be chosen after 2018 and 2021. Binance USDT is the USD proxy; Coinbase USD wicks can differ by a day. A 54% drawdown is shallower than 2018 (−84%) and 2022 (−78%). Amplitude has compressed even if timing has not. September 2026 daily bars after the August monthly archive are an API tail, not a Vision ZIP.
Disclaimer
- ΔTrace Labs is a personal portfolio and research project, not a registered fund, asset manager, broker, exchange, advisory business or licensed virtual-asset service provider.
- It does not manage external capital, accept deposits, provide investment advice, sell signals or offer client trading services.
- Named platforms and evaluation programmes, including Propr, Hyperliquid, Lucid Trading and Tradeify, are not employers or formal affiliates.
- Research on this site is educational and is not a recommendation to buy, sell or hold any instrument. Historical or simulated results are not a live track record.
- No returns, assets under management, clients, partnerships, testimonials or performance figures are claimed unless they can be evidenced. Published indicators are listed only when a public URL exists.