 ΔTrace Labs
Educational research note
When does Binance spot volume surge?
In plain English · the 60-second version
The question. At what time of day is Binance spot trading busiest, and do Korean, London or New York hours matter most?
The result. The busiest hour is 14:00 UTC for BTC, ETH, XRP and SOL. For BTC that hour is 66% busier than an average weekday hour. New York hours carry more volume than Korean hours (38.5% vs 24.0% of BTC's weekday volume).
Caveats. London looks biggest (44.3%) mainly because its window is longer and overlaps New York, so the percentages add up to more than 100%. 'Korea' here means the Korean stock-market clock on Binance, not Korean exchanges like Upbit.
Scope. Built on hourly bars from 2019–2025. It describes when trading happens, not profits or price moves.
Bottom line: Crypto trading peaks around 14:00 UTC, when the US is waking up, and New York hours matter more than Korean hours.
Jargon decoder
- Volume
- How much of an asset was traded. High volume = busy, easy to trade; low volume = quiet and thinner.
- UTC
- One global clock, so times mean the same everywhere. Korea is UTC+9.
- Index (100 = average)
- Each hour's volume relative to the average weekday hour. 100 = typical, 166 = 66% busier.
- Session lift
- Average hourly volume in a session divided by the average weekday hour. 1.32x = 32% busier than a typical hour.
Summary
On weekday Binance spot tape, volume peaks at 14:00 UTC for BTC, ETH, XRP and SOL. New York cash hours carry more than Korean cash hours. London remains the largest inclusive window because it is longer and overlaps New York.
Korea here is the KRX clock on Binance, not Upbit or Bithumb volume. London and New York shares are DST-aware and overlap; they are not additive.
Key figures
Evidence
In plain English
Index 100 = an average weekday hour; BTC at 14:00 is 166. The shares add to more than 100% because London and New York hours overlap (about 20% of volume sits in the overlap); the 'remainder' is the part outside all three sessions.
Hour-of-day profiles
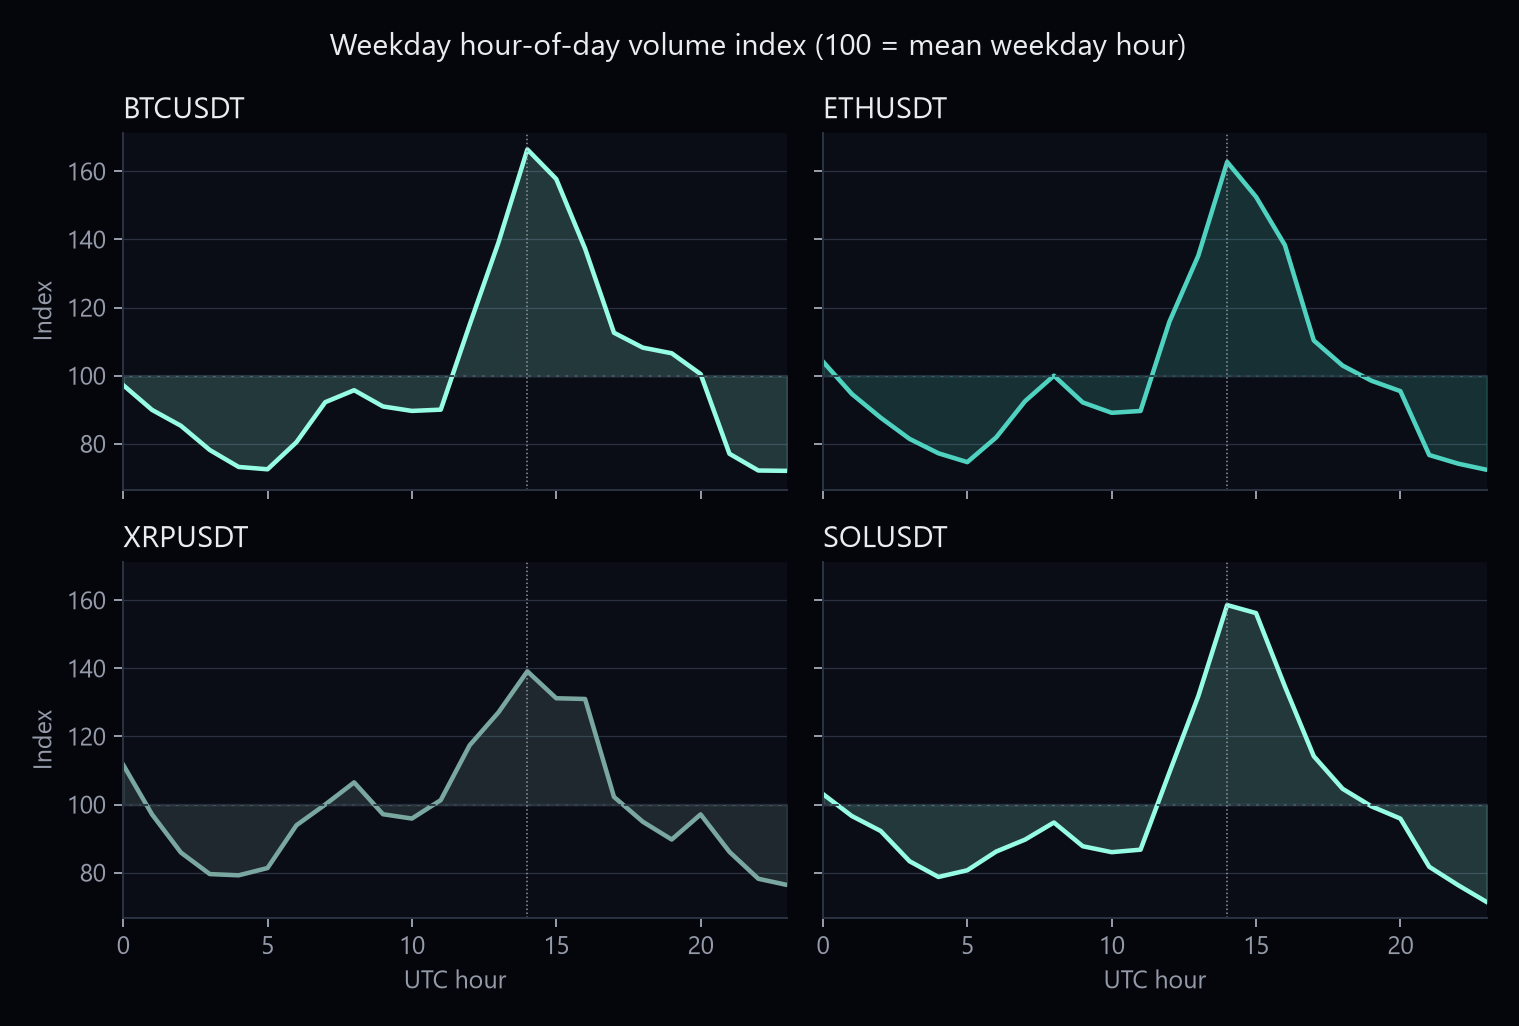
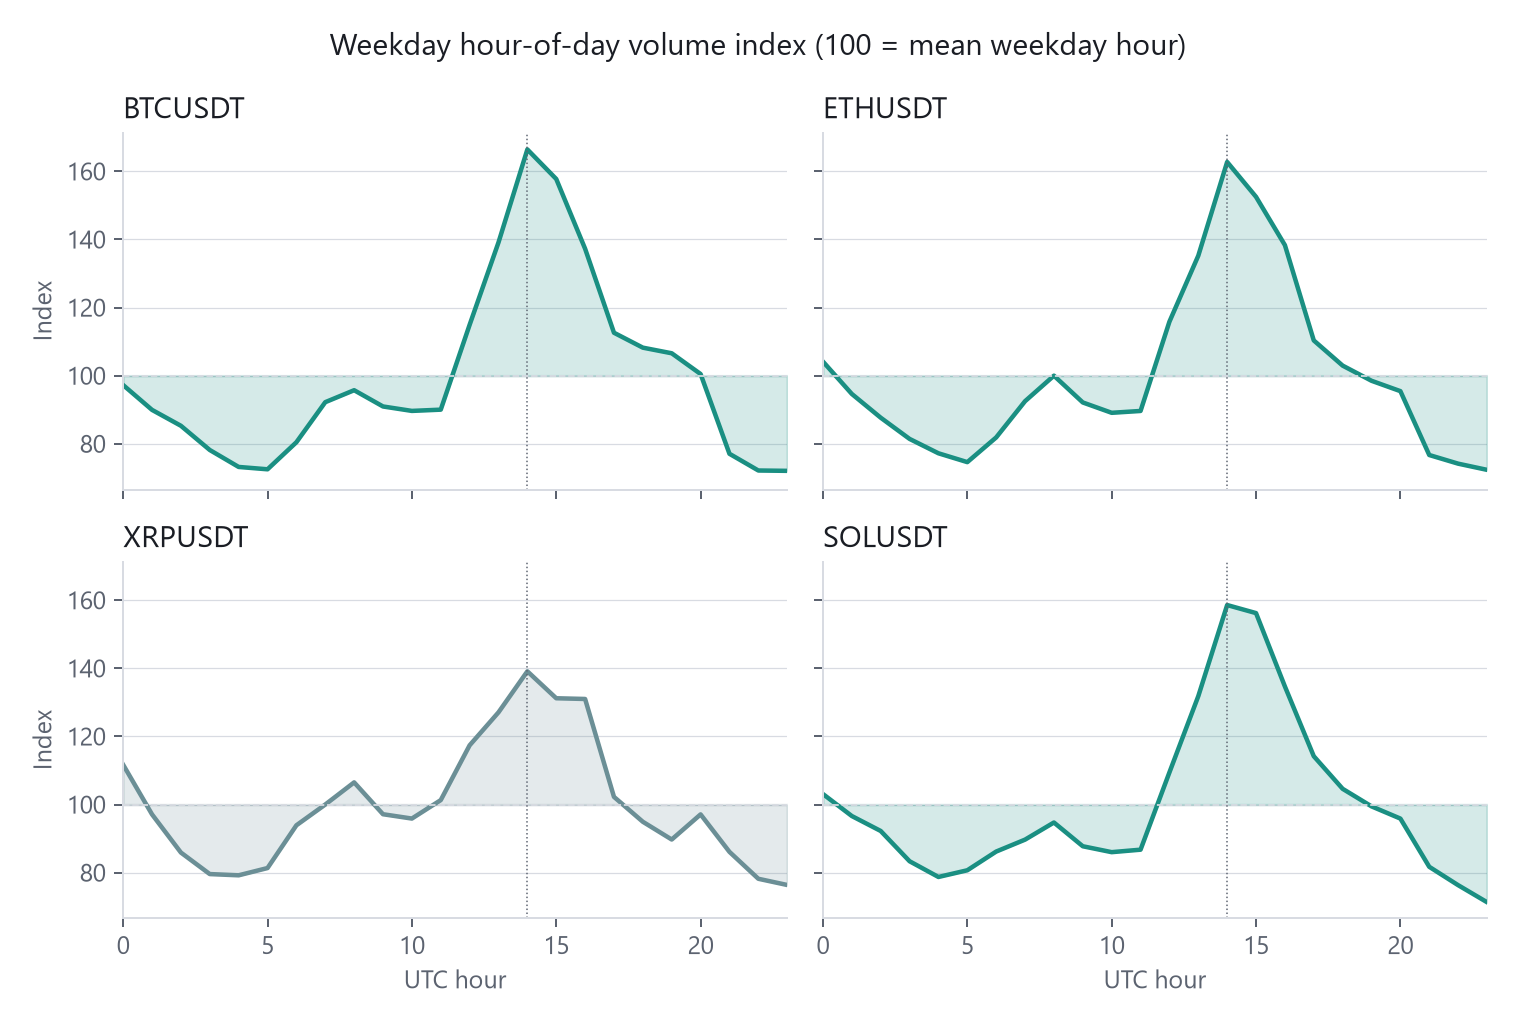
Index 100 is the mean weekday hour. BTC, ETH, XRP: 2019–2025. SOL: first published archive through 2025. Checksum-verified hourly klines.
Session shares
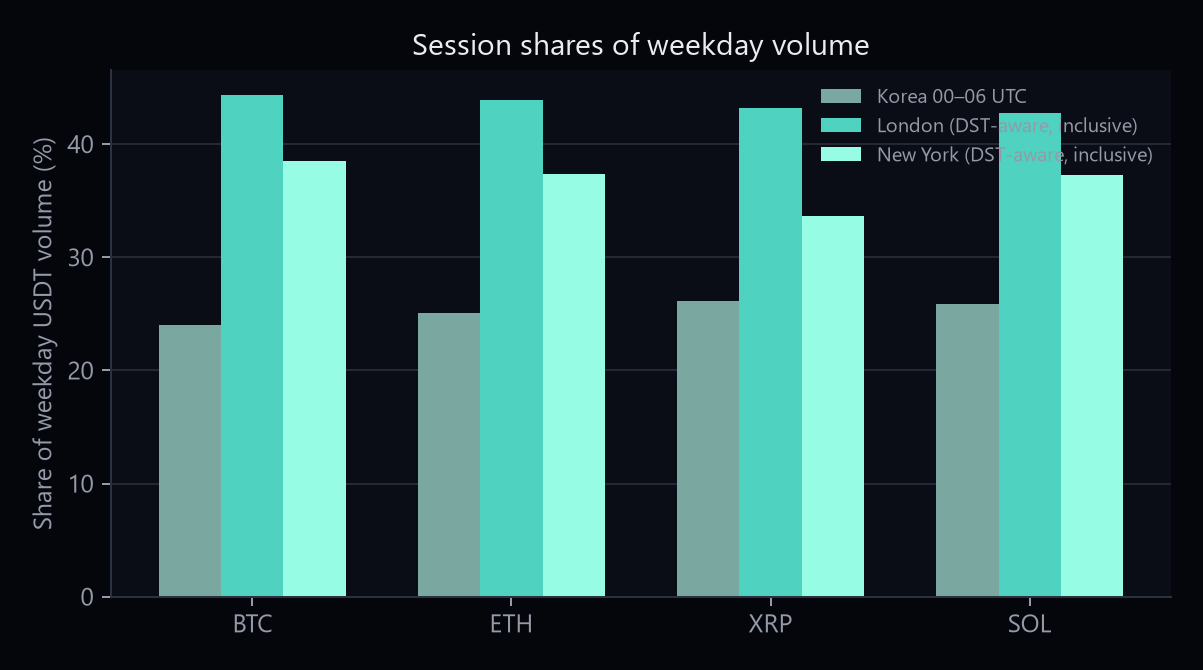
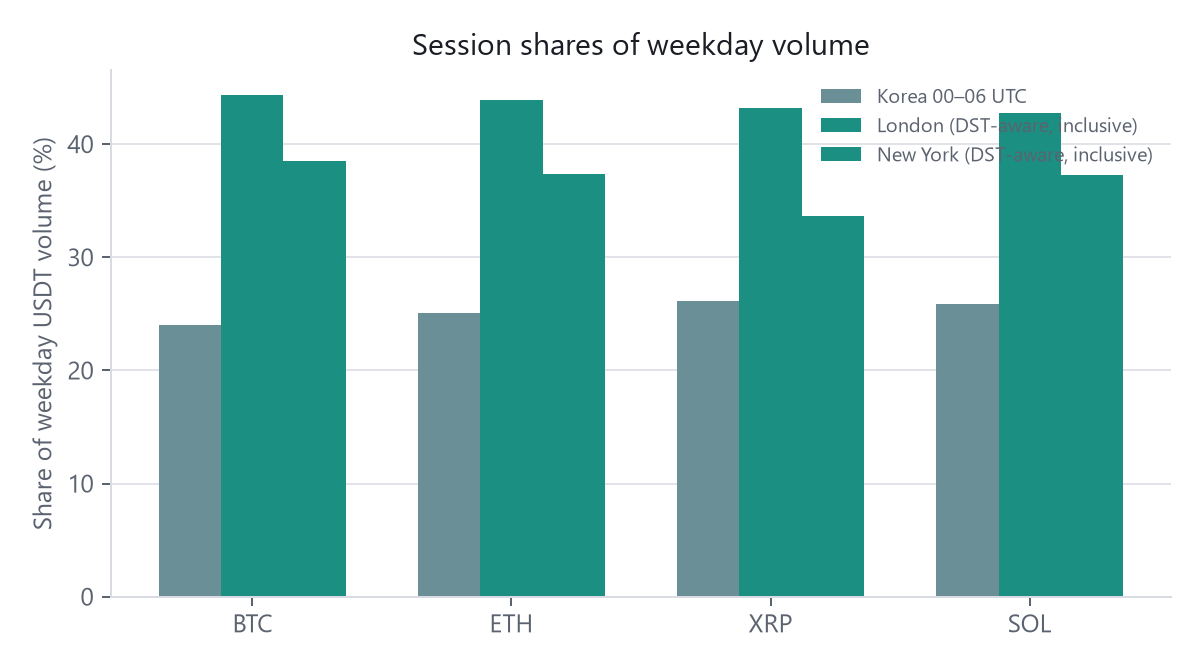
Shares are percent of weekday USDT volume. Lift in the table is mean hourly USDT volume in that session divided by the mean weekday hour.
| Symbol | Coverage | Peak UTC | Peak index | Korea share | Korea lift | NY share | NY lift | London share |
|---|---|---|---|---|---|---|---|---|
| BTCUSDT | 2019–2025 | 14:00 | 166 | 24.0% | 0.82x | 38.5% | 1.32x | 44.3% |
| ETHUSDT | 2019–2025 | 14:00 | 163 | 25.0% | 0.86x | 37.3% | 1.28x | 43.9% |
| XRPUSDT | 2019–2025 | 14:00 | 139 | 26.2% | 0.90x | 33.6% | 1.15x | 43.2% |
| SOLUSDT | 2020-08–2025 | 14:00 | 159 | 25.8% | 0.89x | 37.3% | 1.28x | 42.7% |
London and New York are inclusive and overlap. London’s hourly lift on BTC is 1.18x. Overlap is counted in both inclusive shares; remainder is weekday hours outside Korea, London, and New York.
| Symbol | London–NY overlap | Remainder |
|---|---|---|
| BTCUSDT | 20.1% | 13.3% |
| ETHUSDT | 19.5% | 13.3% |
| XRPUSDT | 17.2% | 14.2% |
| SOLUSDT | 19.4% | 13.5% |
Busiest BTC weekday hours (index vs a typical hour): 14:00 (166, 6.9% of the weekday), 15:00 (158, 6.6%), 13:00 (139, 5.8%), 16:00 (137, 5.7%), 12:00 (115, 4.8%).
Korean cash hours on this tape: 00:00–06:00 UTC. A related 15-minute cut is in Korea fade versus London open.
Caveats
Notes are educational. They are not investment advice and they do not recommend trades. Historical or simulated results are not a live track record.
Hour-of-day intensity is not a statement about edge, spreads or fills. Inclusive London and New York windows overlap by design. This is one venue’s USDT spot (SOL listing is shorter).
Disclaimer
- ΔTrace Labs is a personal portfolio and research project, not a registered fund, asset manager, broker, exchange, advisory business or licensed virtual-asset service provider.
- It does not manage external capital, accept deposits, provide investment advice, sell signals or offer client trading services.
- Named platforms and evaluation programmes, including Propr, Hyperliquid, Lucid Trading and Tradeify, are not employers or formal affiliates.
- Research on this site is educational and is not a recommendation to buy, sell or hold any instrument. Historical or simulated results are not a live track record.
- No returns, assets under management, clients, partnerships, testimonials or performance figures are claimed unless they can be evidenced. Published indicators are listed only when a public URL exists.