 ΔTrace Labs
Educational research note
XRPUSDT weekday, weekend and calendar months
In plain English · the 60-second version
The question. Is XRP traded less on weekends?
The result. Yes, about 70% of weekday volume (285M vs 407M XRP a day), identical to ETH overall. 2023 was the weakest year at 53%.
Caveats. January is the odd one: weekends were busier than weekdays (106.5%). Pooled over just seven Januaries, that likely reflects a few unusual events rather than a pattern. December's average index of 169 versus a median of 53 shows the same thing: a couple of huge years.
Scope. Describes activity on one exchange. The monthly oddities are pooled-month facts, not a trading calendar.
Bottom line: XRP follows the quiet-weekend pattern, but its month-by-month numbers are lumpy because a few big years dominate.
Jargon decoder
- Volume
- How much of an asset was traded. High volume = busy, easy to trade; low volume = quiet and thinner.
- Weekend / weekday
- Average weekend volume divided by average weekday volume. 65% = weekends are about two-thirds as busy.
- Seasonality index
- A month's activity relative to a normal month that year. 100 = typical, 125 = 25% busier, 75 = 25% quieter.
- Mean vs median
- The mean is the average and is dragged around by a few huge values; the median is the middle value. When they disagree, a few extreme periods are driving the result.
Summary
Weekend XRP volume averaged 69.9% of weekday volume on Binance spot: 285 million versus 407 million XRP per day, 2019–2025. The full-sample ratio matches ETH; the month-by-month path does not.
January is the exception: weekend mean exceeded weekday mean (106.5%). February and December sit at 57–58%. 2023 was the weakest year at 52.8%.
Key figures
Evidence
In plain English
Compare the mean and median columns: where they diverge sharply (December 169 vs 53, July 87 vs 57) the average is being pulled by one or two extreme years, so don't lean on those months.
Average daily volume by weekday
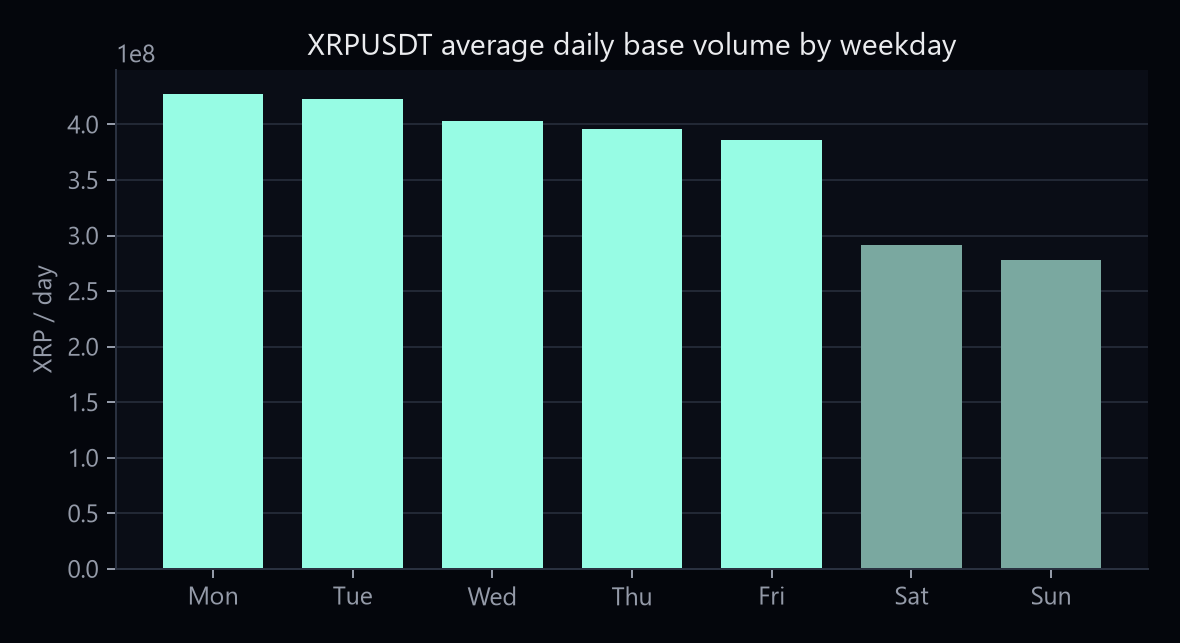
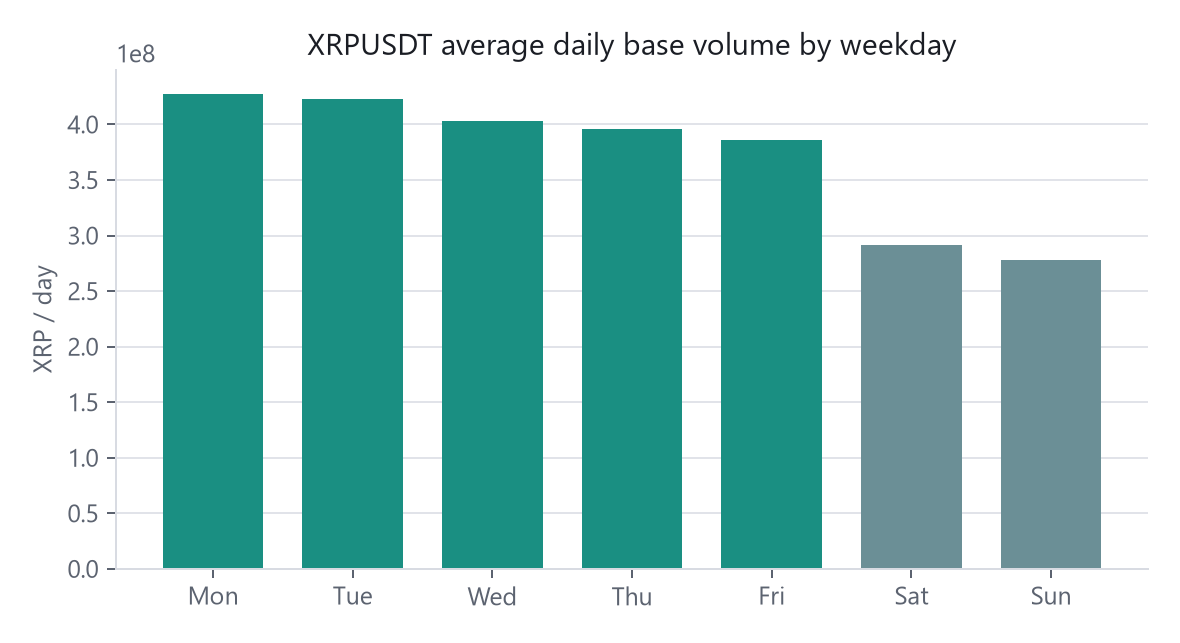
Mean base-asset volume in XRP/day. Official Binance Data Collection monthly 1d kline archives, SHA-256 verified.
| Year | Weekend / weekday | Weekend shortfall |
|---|---|---|
| 2019 | 74.4% | 25.6% |
| 2020 | 74.7% | 25.3% |
| 2021 | 85.4% | 14.6% |
| 2022 | 64.1% | 35.9% |
| 2023 | 52.8% | 47.2% |
| 2024 | 61.3% | 38.7% |
| 2025 | 61.7% | 38.3% |
Calendar month: weekday versus weekend
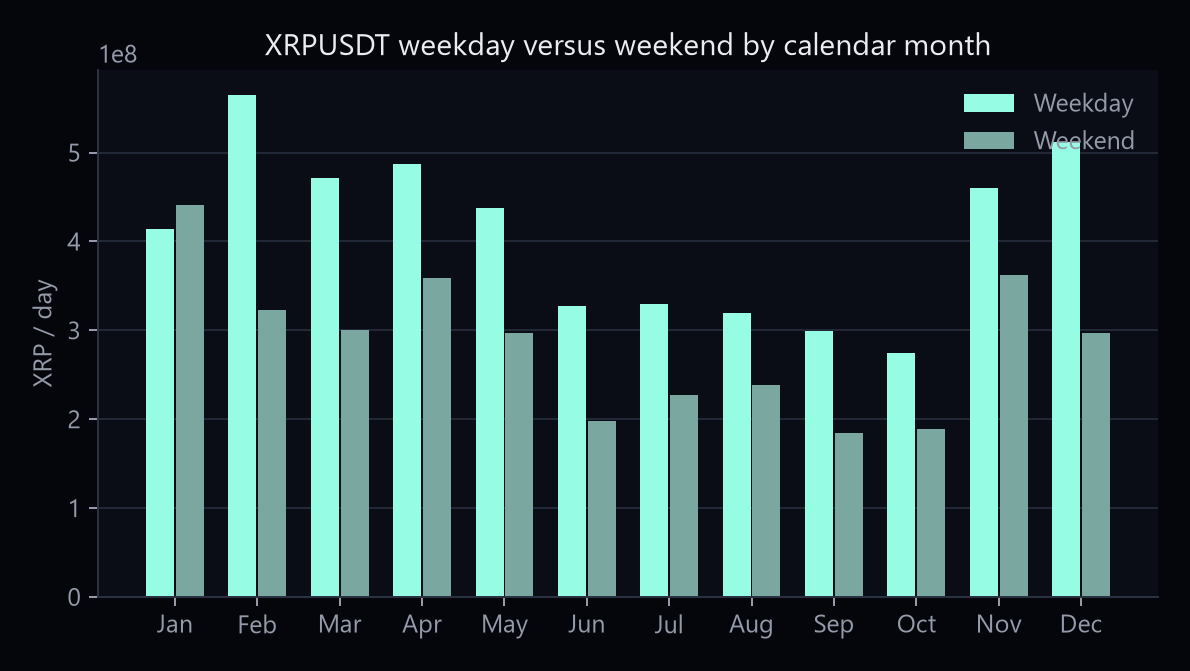
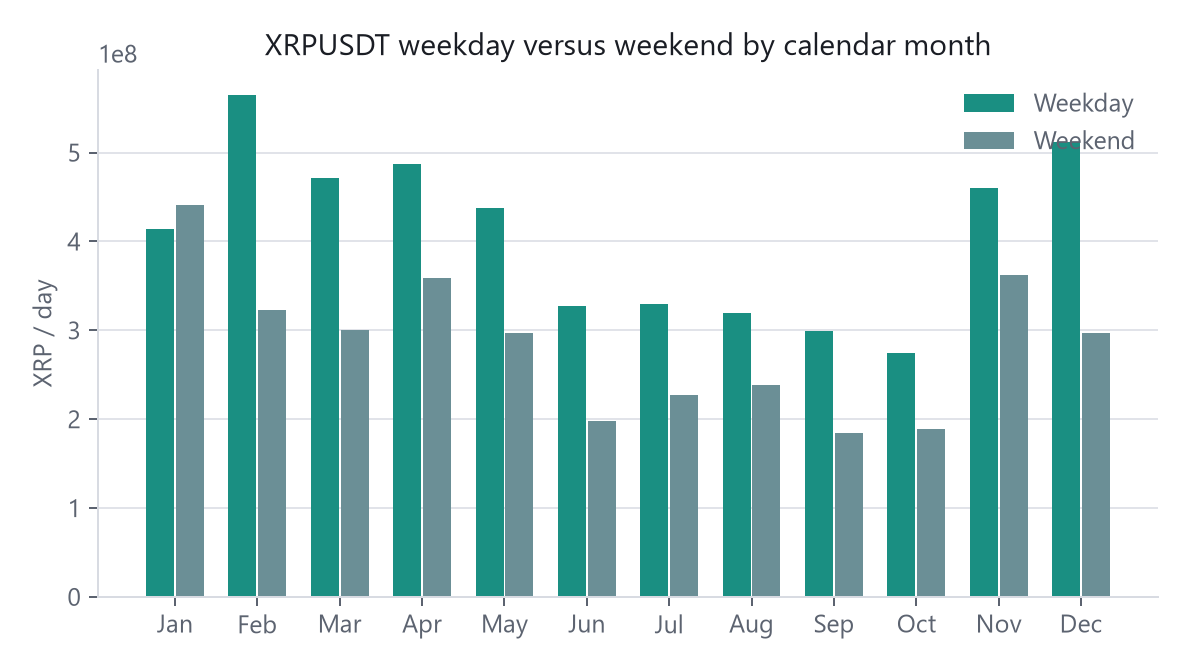
Pooled across complete UTC years 2019–2025. January is the only month where weekends exceed weekdays.
| Month | Weekday mean XRP/day | Weekend mean XRP/day | Weekend / weekday |
|---|---|---|---|
| January | 414,449,025 | 441,212,133 | 106.5% |
| February | 564,540,752 | 323,332,325 | 57.3% |
| March | 471,593,121 | 300,493,747 | 63.7% |
| April | 486,778,506 | 359,389,449 | 73.8% |
| May | 437,973,708 | 296,930,015 | 67.8% |
| June | 327,846,469 | 197,835,199 | 60.3% |
| July | 329,124,245 | 227,499,034 | 69.1% |
| August | 319,202,735 | 238,950,273 | 74.9% |
| September | 299,158,089 | 184,510,440 | 61.7% |
| October | 274,898,767 | 189,433,428 | 68.9% |
| November | 460,518,324 | 362,187,610 | 78.6% |
| December | 511,944,985 | 296,776,863 | 58.0% |
Normalized monthly turnover seasonality
Each month is normalized against its own calendar year’s average daily USDT turnover. 100 equals a typical month for that year.
| Month | Mean index | Median index |
|---|---|---|
| January | 86.3 | 65.4 |
| February | 107.0 | 81.2 |
| March | 95.2 | 119.8 |
| April | 108.4 | 87.2 |
| May | 108.8 | 70.7 |
| June | 79.7 | 73.3 |
| July | 86.6 | 56.8 |
| August | 75.4 | 89.7 |
| September | 70.2 | 65.7 |
| October | 71.8 | 79.8 |
| November | 142.4 | 92.2 |
| December | 169.2 | 53.3 |
November and December have the highest mean indices; December’s median (53.3) shows that mean is a few large years. Seven observations per calendar month are not enough to treat this as a dependable calendar effect.
Caveats
Notes are educational. They are not investment advice and they do not recommend trades. Historical or simulated results are not a live track record.
January’s inversion is a pooled-month fact, not a trading calendar. One venue, UTC daily bars. Cross-asset: weekend volume across names.
Disclaimer
- ΔTrace Labs is a personal portfolio and research project, not a registered fund, asset manager, broker, exchange, advisory business or licensed virtual-asset service provider.
- It does not manage external capital, accept deposits, provide investment advice, sell signals or offer client trading services.
- Named platforms and evaluation programmes, including Propr, Hyperliquid, Lucid Trading and Tradeify, are not employers or formal affiliates.
- Research on this site is educational and is not a recommendation to buy, sell or hold any instrument. Historical or simulated results are not a live track record.
- No returns, assets under management, clients, partnerships, testimonials or performance figures are claimed unless they can be evidenced. Published indicators are listed only when a public URL exists.