 ΔTrace Labs
Educational research note
HYPEUSDT USD-M weekday and weekend volume
In plain English · the 60-second version
The question. Is HYPE (a perpetual futures contract, not spot) traded less on weekends?
The result. Yes, weekends were about 69% of weekday volume (7.51M vs 10.92M HYPE a day) from 30 May to 31 Dec 2025. August was the lowest month at 54%.
Caveats. Only 216 days of data. May's 134.8% ratio comes from just two days, so it carries no weight. Futures volume is also driven by leverage and funding, so it can't be compared with the multi-year spot notes.
Scope. Seven months of futures data is too short to support firm conclusions, so this is a first look rather than a finding.
Bottom line: HYPE also looks quieter on weekends, but with only seven months of futures data that's a hint, not a finding.
Jargon decoder
- Volume
- How much of an asset was traded. High volume = busy, easy to trade; low volume = quiet and thinner.
- Weekend / weekday
- Average weekend volume divided by average weekday volume. 65% = weekends are about two-thirds as busy.
- Perpetual future (perp)
- A futures contract with no expiry, used to bet on price with borrowed exposure.
- UTC
- One global clock, so times mean the same everywhere. Korea is UTC+9.
Summary
On a short Binance USD-M sample, weekend HYPE volume averaged 68.8% of weekday volume: 7.51 million versus 10.92 million HYPE per day, 30 May–31 Dec 2025.
This is not comparable to the multi-year spot studies. Leverage, funding and futures market structure affect volume. Archive months Jan–Apr 2025 were unpublished.
Key figures
Evidence
In plain English
Ignore the May row: it is two days. The complete months (June to December) range from 54% to 82%, so even within this short window the ratio is noisy.
Average daily volume by weekday
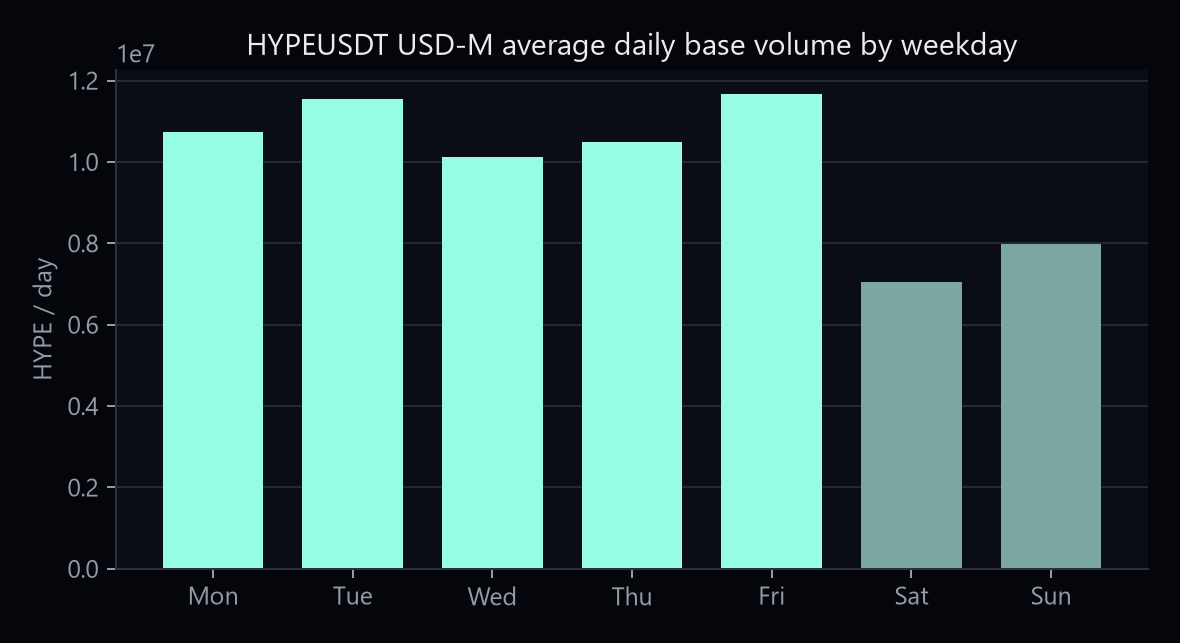
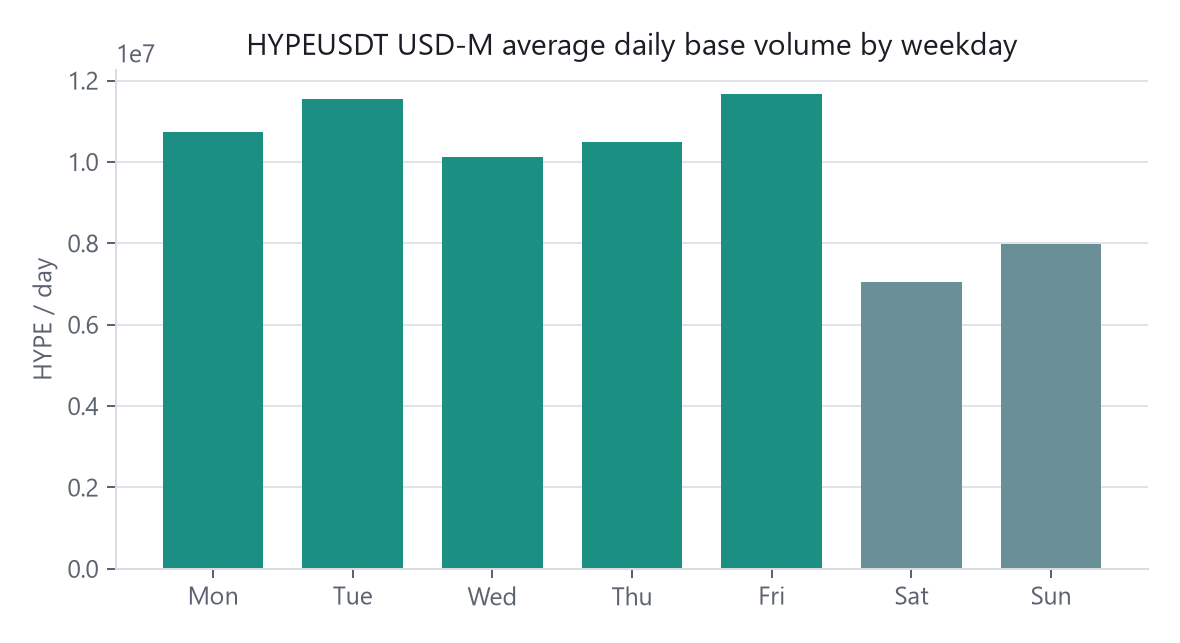
Mean base-asset volume. SHA-256 verified Binance USD-M 1d klines. May 2025 is two calendar days only.
| Year | Weekend / weekday | Weekend shortfall |
|---|---|---|
| 2025 | 68.8% | 31.2% |
Calendar month: weekday versus weekend
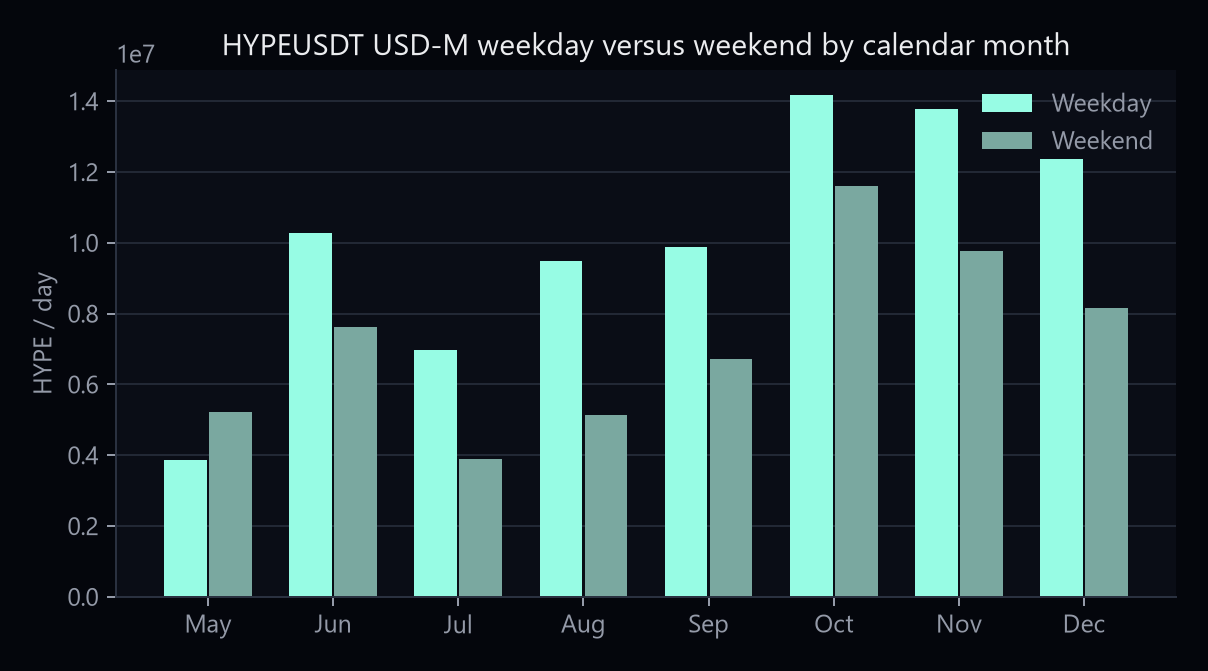
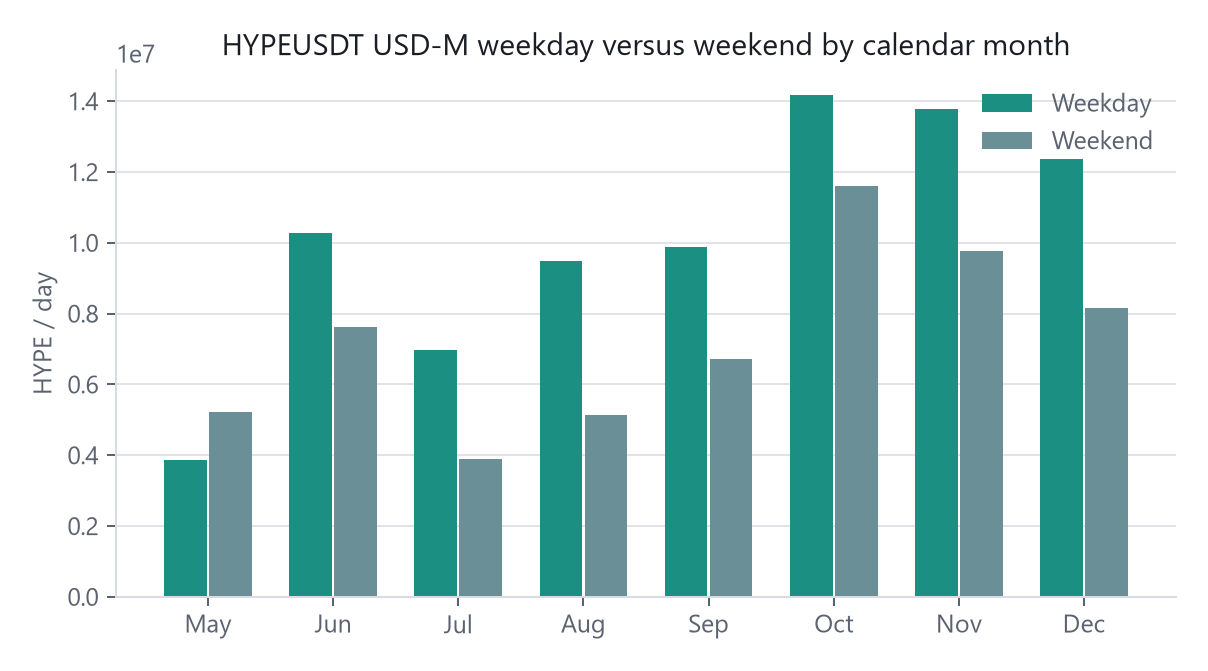
May is two observations and should not be read as a seasonal fact. July and August are the weakest complete months in this window.
| Month | Weekday mean | Weekend mean | Weekend / weekday |
|---|---|---|---|
| May | 3,866,227 | 5,212,806 | 134.8% |
| June | 10,289,641 | 7,610,604 | 74.0% |
| July | 6,963,228 | 3,890,095 | 55.9% |
| August | 9,478,066 | 5,143,447 | 54.3% |
| September | 9,869,636 | 6,712,921 | 68.0% |
| October | 14,168,421 | 11,618,301 | 82.0% |
| November | 13,765,731 | 9,771,483 | 71.0% |
| December | 12,360,444 | 8,151,126 | 65.9% |
Caveats
Notes are educational. They are not investment advice and they do not recommend trades. Historical or simulated results are not a live track record.
Do not pool this futures sample with the 2019–2025 spot weekend conclusions. May’s 134.8% ratio is two days. Companion: cross-asset weekend volume.
Disclaimer
- ΔTrace Labs is a personal portfolio and research project, not a registered fund, asset manager, broker, exchange, advisory business or licensed virtual-asset service provider.
- It does not manage external capital, accept deposits, provide investment advice, sell signals or offer client trading services.
- Named platforms and evaluation programmes, including Propr, Hyperliquid, Lucid Trading and Tradeify, are not employers or formal affiliates.
- Research on this site is educational and is not a recommendation to buy, sell or hold any instrument. Historical or simulated results are not a live track record.
- No returns, assets under management, clients, partnerships, testimonials or performance figures are claimed unless they can be evidenced. Published indicators are listed only when a public URL exists.