 ΔTrace Labs
Educational research note
ETHUSDT weekday, weekend and calendar months
In plain English · the 60-second version
The question. Is Ethereum traded less on weekends?
The result. Yes, about 70% of weekday volume (458,564 vs 655,932 ETH a day, 2019–2025). The lowest year was 2024 at 55%, and the gap has widened since 2021.
Caveats. Same pattern as Bitcoin, slightly milder. It is a liquidity fact, not a trading signal, and the seasonality tables rest on seven observations per month.
Scope. Describes activity on one exchange. It is a liquidity observation, not a test of any strategy, and the headline figures also appear in the cross-asset note.
Bottom line: Ethereum has the same quiet-weekend pattern as Bitcoin, a bit less extreme.
Jargon decoder
- Volume
- How much of an asset was traded. High volume = busy, easy to trade; low volume = quiet and thinner.
- Weekend / weekday
- Average weekend volume divided by average weekday volume. 65% = weekends are about two-thirds as busy.
- Seasonality index
- A month's activity relative to a normal month that year. 100 = typical, 125 = 25% busier, 75 = 25% quieter.
- Mean vs median
- The mean is the average and is dragged around by a few huge values; the median is the middle value. When they disagree, a few extreme periods are driving the result.
Summary
Weekend ETH volume averaged 69.9% of weekday volume on Binance spot: 458,564 versus 655,932 ETH per day, 2019–2025. Same weekend regime as BTC, a little less severe.
The yearly gap widened after 2021, with 2024 the lowest print at 54.9%. A weekend volume gap is not a test of any strategy.
Key figures
Evidence
In plain English
In the seasonality table, when the mean and median differ a lot (e.g. March: mean 97.7 vs median 69.6) a few unusual years are driving the average. May's high mean (130) is similar: the median is only 101.
Average daily volume by weekday
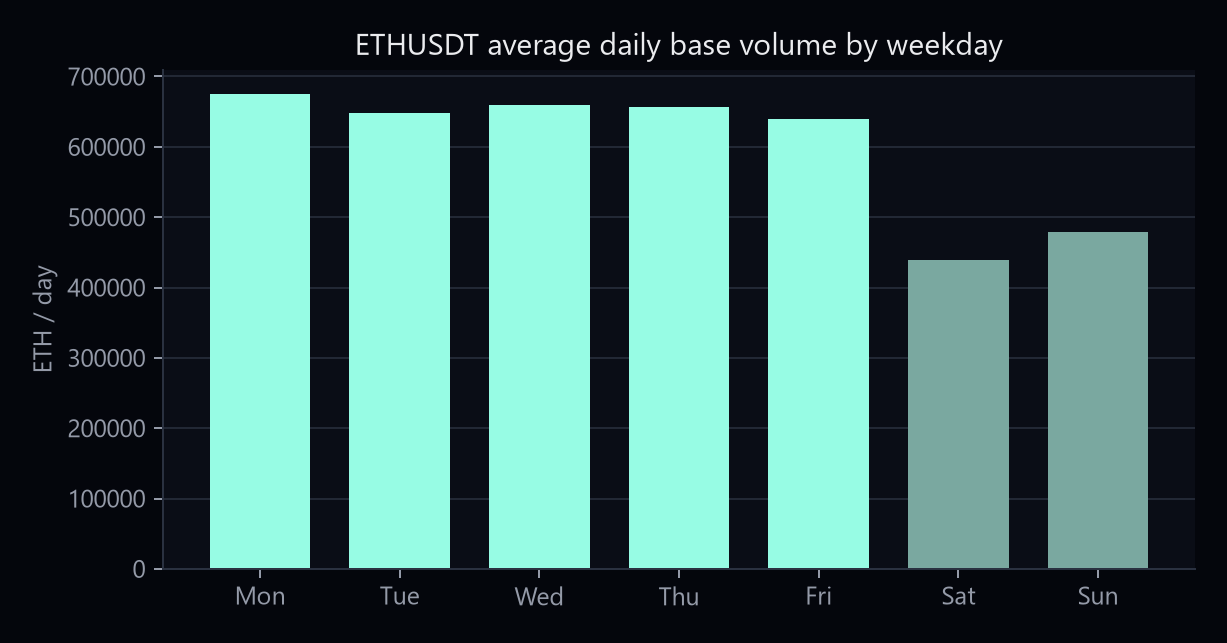
Mean base-asset volume in ETH/day. Official Binance Data Collection monthly 1d kline archives, SHA-256 verified.
| Year | Weekend / weekday | Weekend shortfall |
|---|---|---|
| 2019 | 81.0% | 19.0% |
| 2020 | 80.0% | 20.0% |
| 2021 | 78.7% | 21.3% |
| 2022 | 62.9% | 37.1% |
| 2023 | 63.7% | 36.3% |
| 2024 | 54.9% | 45.1% |
| 2025 | 59.5% | 40.5% |
Calendar month: weekday versus weekend
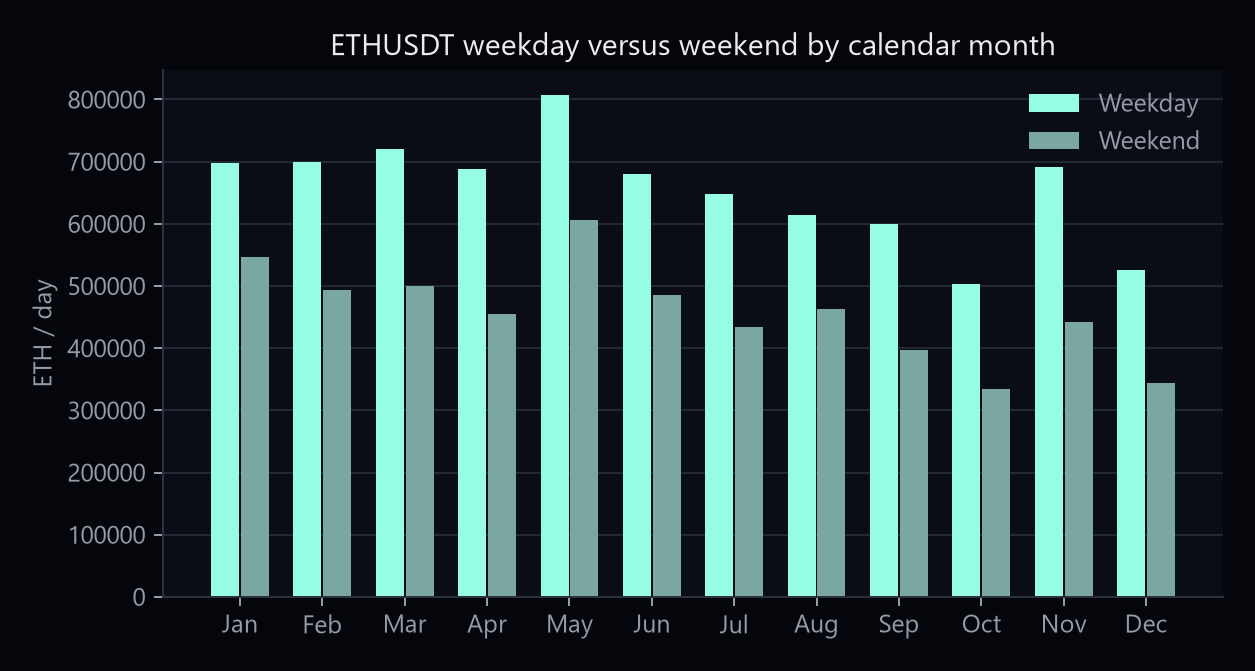
Pooled across complete UTC years 2019–2025.
| Month | Weekday mean ETH/day | Weekend mean ETH/day | Weekend / weekday |
|---|---|---|---|
| January | 698,530 | 545,952 | 78.2% |
| February | 699,915 | 493,361 | 70.5% |
| March | 720,442 | 500,167 | 69.4% |
| April | 688,170 | 455,102 | 66.1% |
| May | 806,839 | 605,467 | 75.0% |
| June | 680,011 | 485,300 | 71.4% |
| July | 648,174 | 434,367 | 67.0% |
| August | 614,838 | 463,385 | 75.4% |
| September | 598,935 | 397,592 | 66.4% |
| October | 503,502 | 334,828 | 66.5% |
| November | 691,830 | 441,562 | 63.8% |
| December | 526,418 | 343,952 | 65.3% |
Normalized monthly turnover seasonality
Each month is normalized against its own calendar year’s average daily USDT turnover. 100 equals a typical month for that year.
| Month | Mean index | Median index |
|---|---|---|
| January | 83.7 | 90.5 |
| February | 95.6 | 94.4 |
| March | 97.7 | 69.6 |
| April | 96.5 | 98.4 |
| May | 130.4 | 100.7 |
| June | 98.5 | 94.5 |
| July | 92.5 | 74.3 |
| August | 102.5 | 99.3 |
| September | 92.4 | 89.9 |
| October | 84.8 | 83.5 |
| November | 119.6 | 109.3 |
| December | 106.0 | 80.3 |
May and November are the stronger months on this normalized measure. Seven observations per calendar month are not enough to treat this as a dependable calendar effect.
Cross-asset companion: weekend volume across names.
Caveats
Notes are educational. They are not investment advice and they do not recommend trades. Historical or simulated results are not a live track record.
One venue, one pair, UTC daily bars. Absolute monthly levels mix different market cycles.
Disclaimer
- ΔTrace Labs is a personal portfolio and research project, not a registered fund, asset manager, broker, exchange, advisory business or licensed virtual-asset service provider.
- It does not manage external capital, accept deposits, provide investment advice, sell signals or offer client trading services.
- Named platforms and evaluation programmes, including Propr, Hyperliquid, Lucid Trading and Tradeify, are not employers or formal affiliates.
- Research on this site is educational and is not a recommendation to buy, sell or hold any instrument. Historical or simulated results are not a live track record.
- No returns, assets under management, clients, partnerships, testimonials or performance figures are claimed unless they can be evidenced. Published indicators are listed only when a public URL exists.