 ΔTrace Labs
Educational research note
Thursday close above the weekly open: a pre-registered six-asset test
In plain English · the 60-second version
The question. If a coin (BTC, ETH, XRP, SOL, TAO, HYPE) is trading above where it opened on Monday when Thursday ends, does the week usually finish above Monday's open too?
The result. Yes, about 83 weeks in 100 (773 of 936 qualifying weeks), versus roughly 50 in 100 for a random week. It held for all six coins, in older and newer data, and in every year checked.
Caveats. Most of that comes from built-in arithmetic rather than a late-week effect. If Thursday is already up, the week only has to avoid handing all of that gain back by Sunday, and pure random price moves would already give about 79%. The genuine extra is about 3.5 points, shrinking to about 0.6 once crypto's usual upward drift is included, which is smaller than the noise in the data.
Could you trade it? Buying Thursday's close and selling Sunday's close averaged about +1.09% per trade after fees, pooled across all six. But only ETH and SOL are individually convincing, 2022 lost money and 2025 broke even. This note does not claim a tradable edge.
Bottom line: When a week is already green on Thursday, it finishes green about 83% of the time. That's statistically real, but mostly because a Thursday gain gives the week a head start. Beyond that head start there's little proof of a real late-week effect, and the trade itself is only marginally profitable.
Jargon decoder
- Event week
- A week where Thursday's close was above Monday's open. These are the weeks being studied.
- Pre-registered
- Rules and pass/fail thresholds were written down before looking at results, so nothing could be tweaked afterwards to get a nicer answer.
- Exact binomial test / p-value
- Asks: if this were a 50/50 coin flip, how unlikely is a result this lopsided? A tiny p-value (3e-28 means 27 zeros after the decimal point) means essentially impossible by luck. Note it only rules out a coin flip, which is the easy bar here.
- Bonferroni
- A stricter pass mark when running several tests at once (6 tests, so p must beat 0.0083 instead of 0.05), so one lucky result can't sneak through.
- Wilson 95% CI
- The plausible range for the true rate given the sample size. Fewer weeks means a wider range.
- In-sample / out-of-sample
- Older data (to 2022) vs newer data (2023 onward). Same pattern in both suggests it isn't just a quirk of one period.
- bps
- Basis points. 1 bps = 0.01%, so 100 bps = 1%.
- t-stat
- Signal-to-noise of an average. Around 2 or above is usually treated as reliable; below 2 could be noise.
- Random walk / drift
- A random walk is price moves with no pattern. Drift is the general upward tendency crypto had over this sample.
- Lift
- How much higher the event-week rate is than the rate for ordinary weeks.
- Survivorship bias
- Only coins that still trade today were tested, so delisted losers are missing.
- Funding (HYPE)
- Periodic payments on futures positions, which would cut returns. Not modelled here.
Summary
Over 1,892 complete Monday-to-Sunday weeks on six Binance markets, a Thursday close strictly above the Monday open was followed by a weekly close strictly above that open in 82.6% of the 936 event weeks (773 of 936). All six assets clear the pre-registered one-sided exact binomial test at the Bonferroni-adjusted threshold; the pooled all-week unconditional rate over the same 1,892 weeks is 49.6%.
The verdict below is the mechanically correct application of the pre-registered decision rule in CHARTER.md §9, as re-derived independently in VALIDATION.md. It is a statement about a conditional frequency under stated definitions, not about a tradable edge, and this note does not upgrade it to one.
Conditioning-mechanics caveat (binding condition of the validation approval). The pre-registered claim as worded — the week closes above its Monday open more often than chance when Thursday closes above that open — is supported on all six assets (6/6 one-sided exact binomial passes at Bonferroni α/6, OOS direction consistent, pooled net-20-bps mean +109 bps, t = 4.31). This is not evidence of a tradable late-week momentum edge: conditioning on a positive Monday-open→Thursday-close move mechanically implies a conditional rate of ≈0.79 (driftless random walk at the empirical leg volatilities, post-hoc diagnostic) — ≈0.82 once the observed positive drift in both legs is included — against an observed 0.826; the excess is within sampling noise. The positive pooled expectancy rests on the backtest leg alone, is uneven across years (2022: −120 bps; 2025: ≈0 bps net 20 bps), and only ETH and SOL individually clear t ≥ 2 at the 20-bps cost scenario.
Key figures
The claim and definitions
In plain English
Weeks run Monday to Sunday (UTC). The condition is "Thursday closed above Monday's open". The outcome is "Sunday closed above Monday's open". The table below is just a data-quality check: how many weeks each coin has, and that nothing is missing.
Claim under test. Per asset, does a Thursday close strictly above the week's Monday open imply that the week closes strictly above that open more often than chance? The pre-registration fixes every parameter before the run: no tuning, no weekday scan, one six-asset Bonferroni family.
Definitions (all times UTC, Binance 1d bars). Week = Monday 00:00:00.000Z → Sunday 23:59:59.999Z. WO = Monday bar open, TC = Thursday bar close, WC = Sunday bar close. Condition TC > WO (strict); outcome WC > WO (strict). Only weeks with the Monday, Thursday and Sunday bars present are used. The incomplete week (any week with Monday ≥ 2026-09-14) is excluded by construction, so the last outcome bar is Sunday 2026-09-13 for every asset.
Decision rule (charter §9). SUPPORT requires 6/6 per-asset passes at Bonferroni α/6 ≈ 0.00833 with ≥ 30 event weeks, out-of-sample direction consistent, and a pooled net-20-bps mean above zero with t ≥ 2. The verdict returned by the analysis is SUPPORT, with the conditioning caveat above carried into the reading.
| Asset | Market | First used bar | Complete weeks | Dropped | Gap days | Archives verified |
|---|---|---|---|---|---|---|
| BTCUSDT | spot | 2017-08-17 | 473 | 1 (0.21%) | 0 | 109/109 |
| ETHUSDT | spot | 2017-08-17 | 473 | 1 (0.21%) | 0 | 109/109 |
| XRPUSDT | spot | 2018-05-04 | 436 | 1 (0.23%) | 0 | 100/100 |
| SOLUSDT | spot | 2020-08-11 | 317 | 1 (0.31%) | 0 | 73/73 |
| TAOUSDT | spot | 2024-04-11 | 126 | 1 (0.79%) | 0 | 29/29 |
| HYPEUSDT | USDT-M futures | 2025-05-30 | 67 | 1 (1.47%) | 0 | 16/16 |
Source: analysis/results.json (data.*, panel.*); data/DATA.md. 13,304 daily bars parsed; the only drops are the leading partial listing week of each asset, so every asset clears the 2% drop gate (worst: HYPE 1.47%). Each archive is verified against its sibling .CHECKSUM (SHA-256); no checksum mismatch, no 404, no interior gap and no duplicate day is recorded for any of the six symbols.
Per-asset primary results
In plain English
Each coin on its own. Example: BTC had 245 qualifying weeks and 205 (83.7%) ended above Monday's open. All six coins clear the strict pass mark, and the older and newer data tell the same story. TAO and HYPE only listed recently, so they have no older data and fewer weeks, which makes them the thinnest samples.
One-sided exact binomial on event weeks, H0: p ≤ 0.5, against the six-test Bonferroni threshold α/6 = 0.00833. Verdicts are per the pre-registered rule; the smallest sample is HYPE at 32 event weeks, which clears the 30-week minimum gate as written.
| Asset | Event weeks n | Outcomes k | p̂ | Wilson 95% CI | Exact p (one-sided) | Bonferroni verdict |
|---|---|---|---|---|---|---|
| BTCUSDT | 245 | 205 | 0.8367 | [0.7853, 0.8778] | 3.405e-28 | CONFIRMED |
| ETHUSDT | 244 | 202 | 0.8279 | [0.7755, 0.8701] | 1.392e-26 | CONFIRMED |
| XRPUSDT | 200 | 170 | 0.8500 | [0.7939, 0.8929] | 3.087e-25 | CONFIRMED |
| SOLUSDT | 161 | 126 | 0.7826 | [0.7127, 0.8393] | 1.455e-13 | CONFIRMED |
| TAOUSDT | 54 | 43 | 0.7963 | [0.6710, 0.8823] | 7.007e-06 | CONFIRMED |
| HYPEUSDT | 32 | 27 | 0.8438 | [0.6825, 0.9314] | 5.654e-05 | CONFIRMED |
| Pooled (descriptive) | 936 | 773 | 0.8259 | [0.8002, 0.8488] | 6.909e-96 | — |
Source: analysis/results.json (primary.*.full, pooled.full.primary). The pooled row is descriptive only and never substitutes for a per-asset verdict (charter §4).
In-sample and out-of-sample
IS = Sunday bar on or before 2022-12-31; OOS = Sunday bar on or after 2023-01-01. TAO and HYPE list after the split and are OOS-only by construction; IS and OOS rows are never pooled silently.
| Asset | Scope | n | k | p̂ | Wilson 95% CI | Exact p |
|---|---|---|---|---|---|---|
| BTCUSDT | IS ≤ 2022-12-31 | 146 | 123 | 0.8425 | [0.7747, 0.8927] | 5.137e-18 |
| BTCUSDT | OOS ≥ 2023-01-01 | 99 | 82 | 0.8283 | [0.7421, 0.8899] | 1.090e-11 |
| ETHUSDT | IS ≤ 2022-12-31 | 143 | 119 | 0.8322 | [0.7624, 0.8845] | 1.246e-16 |
| ETHUSDT | OOS ≥ 2023-01-01 | 101 | 83 | 0.8218 | [0.7358, 0.8842] | 1.864e-11 |
| XRPUSDT | IS ≤ 2022-12-31 | 110 | 95 | 0.8636 | [0.7871, 0.9156] | 1.071e-15 |
| XRPUSDT | OOS ≥ 2023-01-01 | 90 | 75 | 0.8333 | [0.7431, 0.8963] | 4.588e-11 |
| SOLUSDT | IS ≤ 2022-12-31 | 60 | 49 | 0.8167 | [0.7008, 0.8944] | 3.781e-07 |
| SOLUSDT | OOS ≥ 2023-01-01 | 101 | 77 | 0.7624 | [0.6707, 0.8348] | 5.903e-08 |
| TAOUSDT | IS ≤ 2022-12-31 | 0 | 0 | n/a | n/a | n/a |
| TAOUSDT | OOS ≥ 2023-01-01 | 54 | 43 | 0.7963 | [0.6710, 0.8823] | 7.007e-06 |
| HYPEUSDT | IS ≤ 2022-12-31 | 0 | 0 | n/a | n/a | n/a |
| HYPEUSDT | OOS ≥ 2023-01-01 | 32 | 27 | 0.8438 | [0.6825, 0.9314] | 5.654e-05 |
Source: analysis/results.json (primary.*.is / primary.*.oos). OOS direction is consistent on all six assets (p̂ > 0.5 throughout), which is one of the three SUPPORT conditions.
Conditional vs unconditional
In plain English
This compares the roughly 83% to an ordinary week's roughly 50%. The gap looks huge, but it is a bit of an unfair comparison: weeks that are already up on Thursday are naturally more likely to end up. The next sections show how much of the gap is just that.
The unconditional rate is P(WC > WO) over all complete weeks of the asset. Every asset shows a positive lift over its own unconditional rate, tested with a one-sided two-proportion z (pooled variance). The pre-registered Fisher trigger (any expected cell below 5) never fires here: the smallest expected cell in the family is 15.76 for HYPEUSDT, so the z-test is used throughout, as the rule is written.
| Asset | Conditional | Unconditional (all weeks) | Lift | z | p (one-sided z) | Min expected cell |
|---|---|---|---|---|---|---|
| BTCUSDT | 0.8367 | 0.5307 | 0.3061 | 13.827 | 8.759e-44 | 107.01 |
| ETHUSDT | 0.8279 | 0.5116 | 0.3162 | 14.203 | 4.403e-46 | 111.84 |
| XRPUSDT | 0.8500 | 0.4633 | 0.3867 | 14.907 | 1.495e-50 | 92.66 |
| SOLUSDT | 0.7826 | 0.4795 | 0.3031 | 10.974 | 2.537e-28 | 74.80 |
| TAOUSDT | 0.7963 | 0.4524 | 0.3439 | 6.717 | 9.275e-12 | 24.43 |
| HYPEUSDT | 0.8438 | 0.5075 | 0.3363 | 5.265 | 7.024e-08 | 15.76 |
| Pooled | 0.8259 | 0.4958 | 0.3301 | — | — | — |
Source: analysis/results.json (lift.*, pooled.full). Because the conditional set is a subset of the all-week set the two proportions are dependent, which makes the pooled-variance z mildly conservative; the direction of every conclusion is unaffected. The formal z-statistic contrasts conditional against non-event weeks; the printed lift column uses the all-week rate — the two signs agree by construction.
Observed conditional, unconditional, and the random-walk baseline, by asset
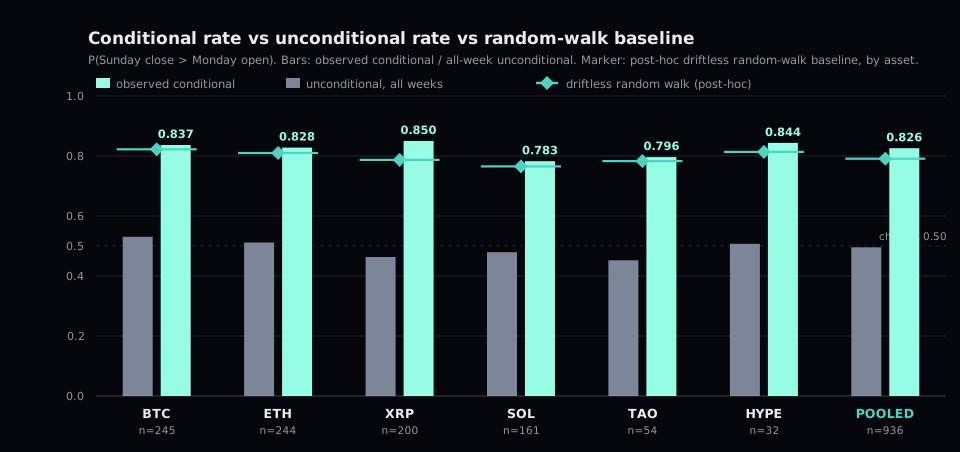
Source: analysis/results.json (primary.*.full.phat, primary.*.unconditional.full.phat, post_hoc.random_walk_benchmark.*.implied_conditional_rate). The baseline marker is the post-hoc driftless reference discussed in "The conditioning caveat" below; it is not part of the pre-registered test and carries no inference.
The simple long backtest (gross / 10 / 20 / 40 bps)
In plain English
What if you bought at Thursday's close whenever the condition was met and sold on Sunday? Average +1.09% per trade after fees. Why 83% of weeks end green but only about 53% of trades win: the 83% counts from Monday's open, when Thursday had already banked the gain. The trade only captures Thursday to Sunday, which is close to a coin flip, and it is profitable only because wins are bigger than losses. By coin, SOL and ETH carry it. By year, 2022 lost about 1.2% per trade and 2025 was flat, so it is not steady.
The backtest leg is an accounting of the same event weeks under stated cost assumptions: long at the Thursday bar close whenever TC > WO, exit at the Sunday bar close, 1× unlevered, r = WC/TC − 1, all figures USDT-denominated. Costs are 0 (gross), 10 (one maker side / fee discount), 20 (retail spot taker both sides) bps round trip. The 40-bps column is a 2× slippage stress run labelled exploratory/post-hoc; it is not part of the pre-registered table.
| Pooled scenario | Trades | Mean (bps) | Median | Hit rate | t of mean | p (two-sided) |
|---|---|---|---|---|---|---|
| Gross | 936 | +129.0 | 0.0050 | 54.2% | 5.097 | 4.183e-07 |
| 10 bps round trip | 936 | +119.0 | 0.0040 | 53.1% | 4.702 | 2.970e-06 |
| 20 bps round trip | 936 | +109.0 | 0.0030 | 52.7% | 4.306 | 1.835e-05 |
| 40 bps round trip (exploratory stress) | 936 | +89.0 | 0.0010 | 51.2% | 3.516 | 4.589e-04 |
Source: analysis/results.json (backtest.POOLED.full.scenarios). Pooled rows weight each event week equally, not each unit of capital. The 40-bps scenario survives double the retail-cost assumption; it changes no part of the reading above.
Per asset, net 20 bps
| Asset | Trades | Mean net 20 bps | Median | Hit rate | t of mean | Mean at 40 bps |
|---|---|---|---|---|---|---|
| BTCUSDT | 245 | +28.7 bps | 0.0000 | 50.2% | 0.953 | +8.7 bps |
| ETHUSDT | 244 | +86.9 bps | 0.0046 | 54.9% | 2.088 | +66.9 bps |
| XRPUSDT | 200 | +115.1 bps | 0.0013 | 51.0% | 1.841 | +95.1 bps |
| SOLUSDT | 161 | +256.8 bps | 0.0102 | 56.5% | 3.118 | +236.8 bps |
| TAOUSDT | 54 | +147.4 bps | 0.0074 | 51.9% | 1.083 | +127.4 bps |
| HYPEUSDT | 32 | +46.1 bps | −0.0050 | 46.9% | 0.374 | +26.1 bps |
| Pooled | 936 | +109.0 bps | 0.0030 | 52.7% | 4.306 | +89.0 bps |
Source: analysis/results.json (backtest.*.full.scenarios[20], scenarios[40]). Only ETH (t = 2.088) and SOL (t = 3.118) individually clear t ≥ 2 at the 20-bps cost scenario; the pooled SUPPORT economics leg is met, per-asset economics are not established and must not be read as such.
Pooled net-20-bps mean per event week, by Sunday-bar year
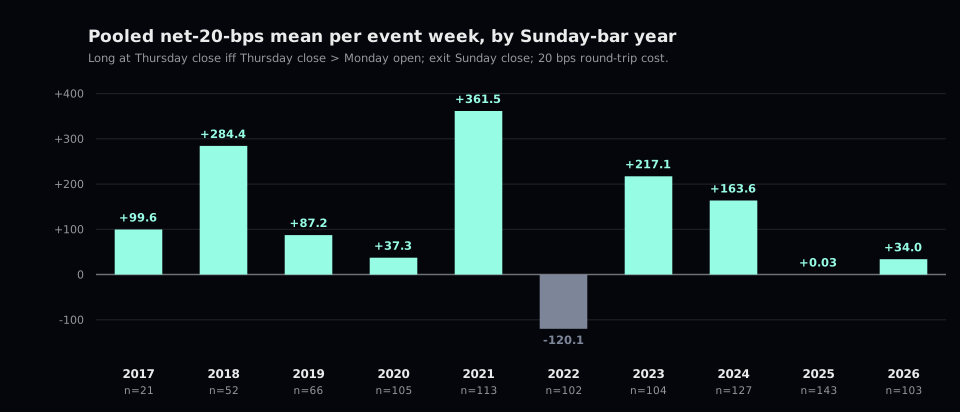
Source: analysis/results.json (regimes.by_year_pooled[*].backtest_net20bps). Same event weeks as the tables above, sliced by Sunday-bar year; the conditional rate stays above 0.5 in every year while the cost-adjusted mean does not.
| Sunday-bar year | Event weeks | Conditional p̂ | Net-20-bps mean | t of mean |
|---|---|---|---|---|
| 2017 | 21 | 0.8571 | +99.6 bps | 0.528 |
| 2018 | 52 | 0.9231 | +284.4 bps | 2.796 |
| 2019 | 66 | 0.8485 | +87.2 bps | 1.370 |
| 2020 | 105 | 0.8571 | +37.3 bps | 0.476 |
| 2021 | 113 | 0.9027 | +361.5 bps | 3.370 |
| 2022 | 102 | 0.7059 | −120.1 bps | −2.020 |
| 2023 | 104 | 0.8654 | +217.1 bps | 3.386 |
| 2024 | 127 | 0.8425 | +163.6 bps | 2.257 |
| 2025 | 143 | 0.7832 | +0.03 bps | 0.001 |
| 2026 | 103 | 0.7573 | +34.0 bps | 0.560 |
Source: analysis/results.json (regimes.by_year_pooled). 2022 is negative and 2025 is flat: the conditional rate is stable through time, the cost-adjusted expectancy is not.
Robustness
In plain English
Stress tests: moving where the week starts, removing the wild years 2020 and 2022, and checking year by year. The 83% survives all of them, so the number is stable. That shows the statistic is solid, not that it is a hidden edge.
R1–R4 are pre-registered diagnostics and carry no inference; the primary verdict stands on the base specification. R2 reproduces the primary panel exactly, because no week has TC exactly equal to WO on any asset.
| Variant | Scope | Result | Reading |
|---|---|---|---|
| R1 | Sunday-anchored weeks (Sun open → Sat close) | Pooled 798/940, p̂ = 0.8489, p = 9.854e-112; per asset p̂ 0.7963 (SOL) to 0.8838 (ETH) | Boundary choice does not carry the result |
| R2 | Non-strict condition TC ≥ WO | Identical to the primary panel on all six assets; 0 weeks with TC == WO | Strictness carries no information at float prices |
| R3 | Excluding weeks whose Sunday bar falls in 2020 or 2022 | Pooled 611/729, p̂ = 0.8381, p = 2.630e-81; weeks removed 104/104/104/71/0/0 | Not a COVID-rally or bear-market artefact |
| R4 | Conditional rate by Sunday-bar year | All 41 asset-year cells above 0.5; minimum 0.6000 (XRP 2026, 9/15) | Rate stability through time |
Source: analysis/results.json (robustness.R1–R4, robustness.pooled). R3's removed weeks map to BTC/ETH/XRP 104 each, SOL 71, TAO and HYPE none. Full per-asset R1/R3 rows and the complete R4 grid are in analysis/RESULTS.md §5.
The conditioning caveat (random-walk benchmark)
In plain English · read this one
The most important section. Imagine a 4-day race where you check the score on day 3: whoever is ahead then is very likely still ahead at the end, simply because of the head start. Likewise, if Thursday is above Monday's open, the week is likely to end above it even with completely random prices (about 75% if the two legs are equally volatile, about 79% with real volatilities). The observed 83% is only about 3.5 points above that, and about 0.6 points once drift is included, which is within noise. So most of the headline result is arithmetic, not a late-week effect.
This subsection is post-hoc and not pre-registered; it is the binding caveat on how the verdict may be read. The pre-registered null (p ≤ 0.5) is not the only reference point available for this design: conditioning on a positive Monday-open→Thursday-close move mechanically raises the probability that the week closes above its open. For independent zero-mean legs with standard deviations s₁ and s₂, P(WC > WO | TC > WO) = 0.5 + atan(s₁/s₂)/π — already 0.75 when the legs have equal volatility. Feeding in each asset's empirical leg volatilities gives the reference below.
| Scope | Weeks | SD Mon open → Thu close | SD Thu close → Sun close | Ratio | Random-walk baseline | Observed conditional | Excess |
|---|---|---|---|---|---|---|---|
| BTCUSDT | 473 | 7.93% | 4.95% | 1.601 | 0.8223 | 0.8367 | +0.0144 |
| ETHUSDT | 473 | 9.74% | 6.62% | 1.472 | 0.8100 | 0.8279 | +0.0178 |
| XRPUSDT | 436 | 10.94% | 8.66% | 1.264 | 0.7869 | 0.8500 | +0.0631 |
| SOLUSDT | 317 | 11.59% | 10.53% | 1.100 | 0.7652 | 0.7826 | +0.0174 |
| TAOUSDT | 126 | 11.97% | 9.72% | 1.232 | 0.7829 | 0.7963 | +0.0134 |
| HYPEUSDT | 67 | 10.80% | 7.16% | 1.508 | 0.8136 | 0.8438 | +0.0301 |
| Pooled | 1892 | 10.15% | 7.81% | 1.299 | 0.7911 | 0.8259 | +0.0347 |
Source: analysis/results.json (post_hoc.random_walk_benchmark). The pooled observed rate sits 3.5 points above the driftless baseline; adding the observed positive drift in both legs raises the pooled mechanical baseline to ≈0.82 (post-hoc extension recorded in VALIDATION.md), leaving an excess of ≈0.6 point against a binomial standard error of ≈1.2 points at n = 936 — within sampling noise.
The practical consequence is stated plainly and without softening: most of the distance between 0.5 and the observed ≈0.83 is a mechanical property of conditioning on a positive move, not a discovered late-week effect. Nothing in the pre-registered panel is changed by this diagnostic, and no inferential claim is drawn from it.
Caveats and residual risk
In plain English
The fine print, in short: the head-start effect explains most of the result; only ETH and SOL show convincing trade profits on their own; HYPE passes with just 32 weeks, barely above the 30-week minimum; only currently listed coins were tested; and the backtest assumes perfect fills at the close with no slippage, taxes or HYPE funding costs. Real-world results would likely be worse.
Conditioning mechanics (binding). See the caveat in the Summary and the random-walk benchmark above: the pre-registered null is the weaker of the two available reference points for this design, and the excess over the mechanical baseline is within sampling noise.
Per-asset economics are not established. At 20 bps only ETH (t = 2.088) and SOL (t = 3.118) individually clear t ≥ 2; BTC, XRP, TAO and HYPE do not. The SUPPORT verdict's economics leg is pooled-only and must not be upgraded to per-asset tradability.
Sample end and completeness. The sample ends at the Sunday 2026-09-13 bar; the incomplete week beginning Monday 2026-09-14, including the still-forming 2026-09-19 bar, is excluded everywhere. 1,892 of 1,898 expected weeks are complete (0.32% dropped); all drops are documented leading listing weeks, and the worst per-asset drop is HYPE at 1.47%, inside the 2% gate.
Minimum-sample fragility. HYPE has 32 event weeks against a pre-registered gate of 30. The validator's adversarial sweep found this to be the only fragile knob: at a gate 20% higher (36) HYPE would fall out and the "all six" formulation would break, even though HYPE's exact p = 5.654e-05 still clears α/6.
Appendix-tier assets. TAO and HYPE have no in-sample window (they list after the 2022-12-31 split) and carry the fewest event weeks; per the charter their verdicts cannot confirm the claim on their own.
Survivorship. The universe is six currently listed markets. Nothing here generalises to delisted assets, and the bias is stated, not fixable with this data.
Execution and cost assumptions. Fills are assumed exactly at the bar close on which the condition is fixed, with no slippage beyond the stated cost scenarios, no market impact, no partial fills and no taxes. That fill convention is optimistic and is disclosed rather than modelled.
HYPE funding not modelled. HYPEUSDT is a USDT-M futures market and a ~3-day hold crosses roughly ten funding prints; funding is not modelled anywhere in these figures.
USDT ≠ USD. All figures are USDT-denominated with no conversion; USDT does not track USD one-for-one.
Excursion and drawdown granularity. Maximum favourable and adverse excursion statistics are daily-bar bounds only, and the reported maximum drawdowns are per-trade-sequence figures on the compounded event-week curve, not calendar mark-to-market drawdowns.
Multiplicity. Exactly one six-test Bonferroni family is used, and Thursday is the claimant's a priori weekday; no weekday scan was run. R1–R4 and the random-walk benchmark are labelled diagnostics and carry no inference. Look-ahead is absent by construction: the condition is fixed at the Thursday close, the fill is that same close, and the outcome is the later Sunday close.
Disclaimer
- ΔTrace Labs is a personal portfolio and research project, not a registered fund, asset manager, broker, exchange, advisory business or licensed virtual-asset service provider.
- It does not manage external capital, accept deposits, provide investment advice, sell signals or offer client trading services.
- Named platforms and evaluation programmes, including Propr, Hyperliquid, Lucid Trading and Tradeify, are not employers or formal affiliates.
- Research on this site is educational and is not a recommendation to buy, sell or hold any instrument. Historical or simulated results are not a live track record.
- No returns, assets under management, clients, partnerships, testimonials or performance figures are claimed unless they can be evidenced. Published indicators are listed only when a public URL exists.