 ΔTrace Labs
Educational research note
Which of these coins move together?
In plain English · the 60-second version
The question. Which coins move together, and how closely?
The result. BTC and ETH are the tightest pair (correlation 0.81 on daily returns). SOL and XRP both sit at 0.59 with BTC, TAO at 0.65 and HYPE at 0.52. HYPE is the most independent coin in the set.
Caveats. Different coins have different amounts of history (HYPE only 458 days), so the windows aren't like-for-like. The hourly numbers (0.77–0.88) use a shorter recent window, so don't compare them directly with the daily ones. Moving together isn't causation or a trade.
Scope. A descriptive study on daily log returns, with a Spearman rank cross-check and an hourly check. Windows differ by coin because their histories differ.
Bottom line: Big coins mostly rise and fall together, ETH most closely with Bitcoin, so holding several of them gives you less diversification than it looks like.
Jargon decoder
- Correlation (Pearson ρ)
- −1 to +1: how closely two things move together. 0 = unrelated, +1 = lockstep, negative = opposite. Under about 0.2 is weak; above about 0.5 is strong.
- Beta
- How big one coin's moves are versus another's. Beta 1.3 vs BTC = it moves about 30% more than Bitcoin. Beta depends on the window used, so check which one a figure comes from.
- Rolling 60-day
- A correlation recomputed over a moving 60-day window, to see how the relationship changes over time.
- Spearman
- A cross-check on correlation using rankings rather than raw values, so a few extreme days can't distort it.
Summary
On overlapping daily log returns, BTC and ETH are the tightest majors pair (Pearson 0.81). Versus Bitcoin, ETH stays closest and XRP is the loosest of BTC/ETH/SOL/XRP.
TAO’s Pearson versus BTC is 0.65 on the TAO-listing window. HYPE’s Pearson versus BTC is 0.52 on USD-M futures since listing. That HYPE sample is short; it is not a seven-year fact. Co-movement is not a pairs trade and not causation.
Key figures
Coverage
Majors window: 12 Aug 2020 – 31 Aug 2026 (2,211 overlapping days) for BTC, ETH, SOL, XRP. TAO overlay: 12 Apr 2024 – 31 Aug 2026 (872 days). All six: 31 May 2025 – 31 Aug 2026 (458 days). HYPE is USD-M perpetual klines, not spot.
Evidence
In plain English
How to read a correlation matrix: each cell is the correlation between the row and column coin (1.00 on the diagonal because a coin matches itself). About 0.8 is tight, about 0.5 is loose. Beta above 1 means it tends to move more than Bitcoin does. ETH is 1.11 on the long majors window (2020–2026) and 1.35 on the short six-name window (31 May 2025 onward), so the window matters.
Majors: daily Pearson
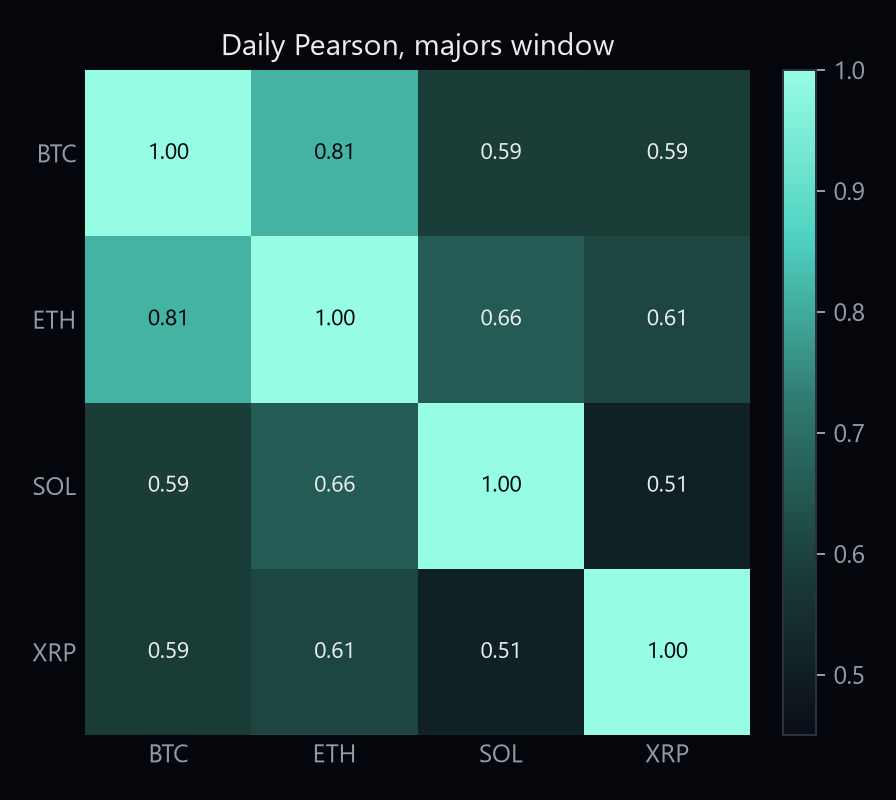
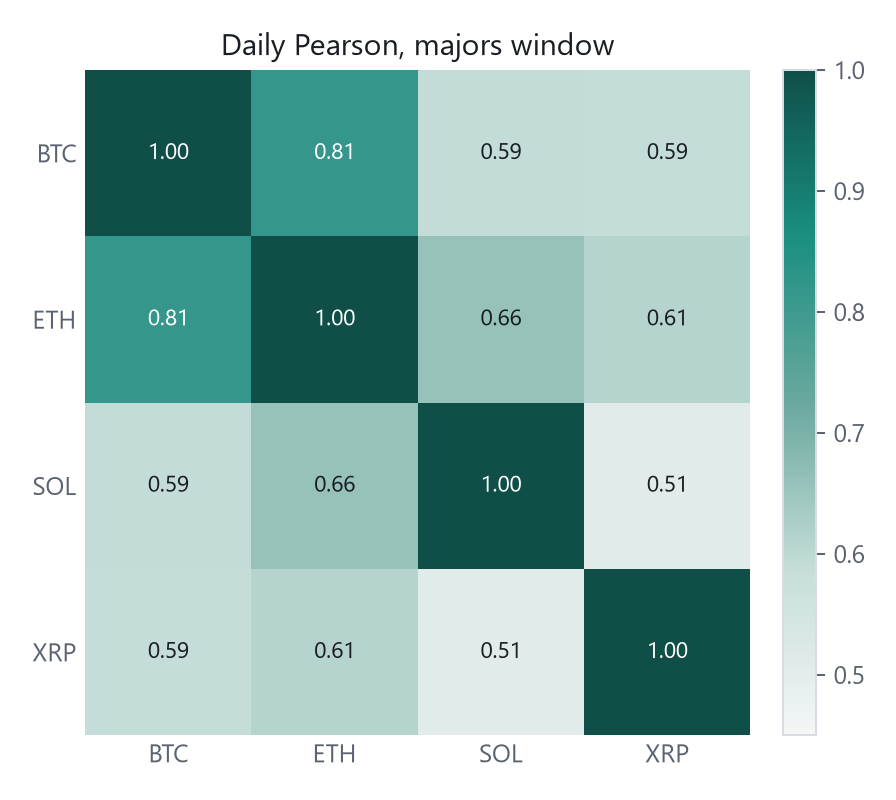
Pearson of daily log returns, overlapping majors window. Spearman ranks are in the supporting CSVs; if they sit close to Pearson, a few crash days are not driving the result.
| Series | BTC | ETH | SOL | XRP |
|---|---|---|---|---|
| BTC | 1.00 | 0.81 | 0.59 | 0.59 |
| ETH | 0.81 | 1.00 | 0.66 | 0.61 |
| SOL | 0.59 | 0.66 | 1.00 | 0.51 |
| XRP | 0.59 | 0.61 | 0.51 | 1.00 |
TAO overlay
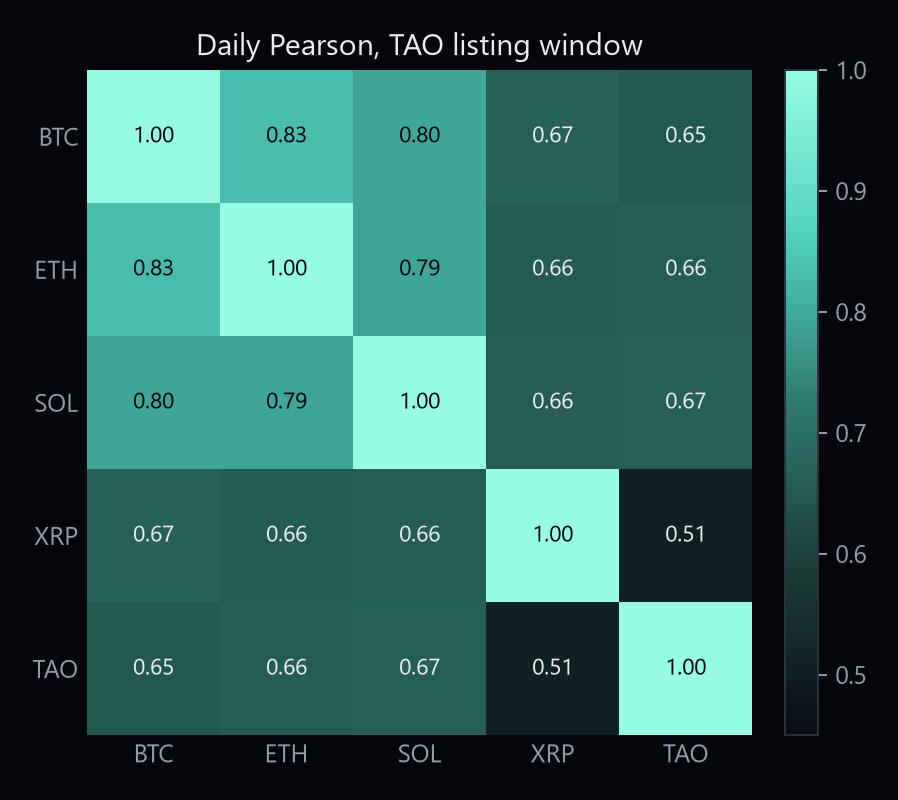
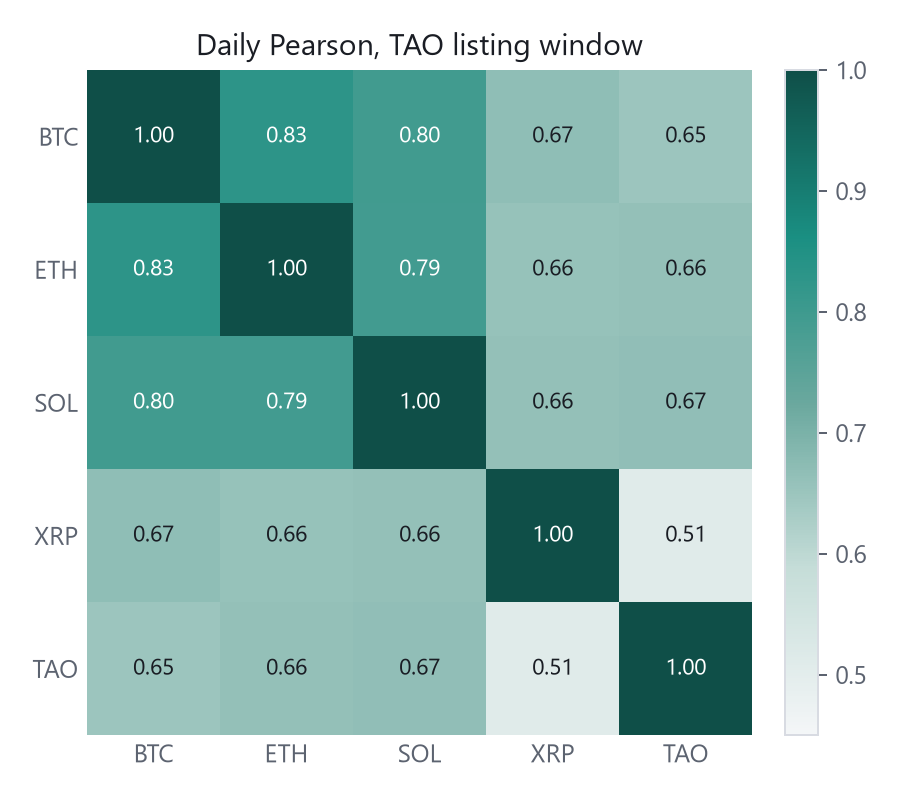
Same method on the TAO listing window. TAO versus BTC is 0.65 — a weaker linear co-move than the majors on their longer sample.
All six from HYPE listing
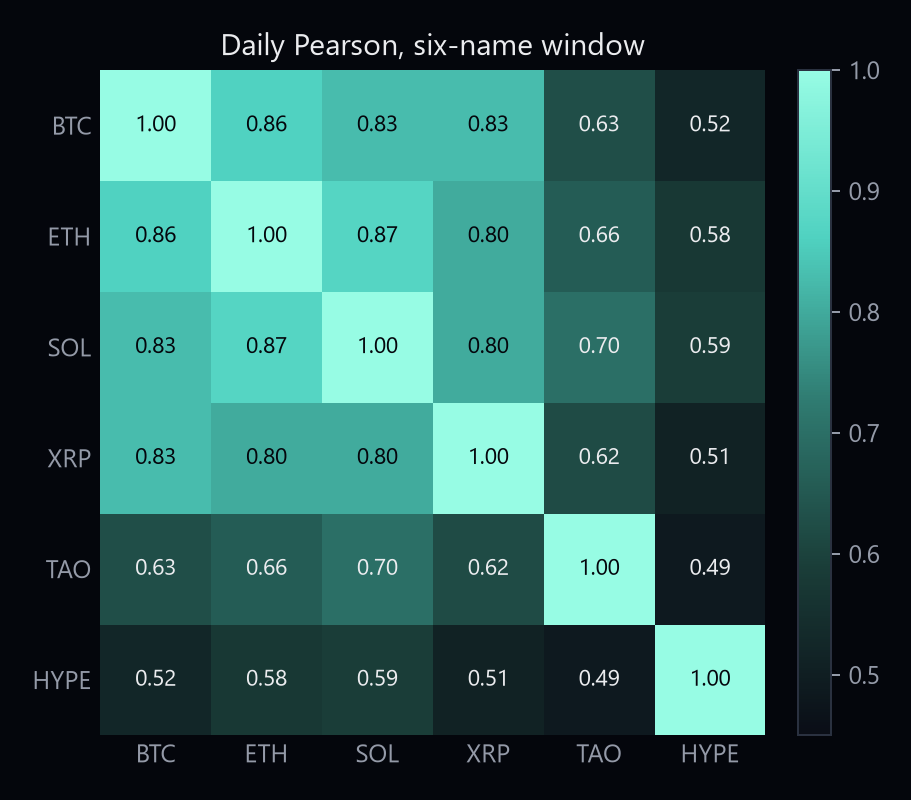
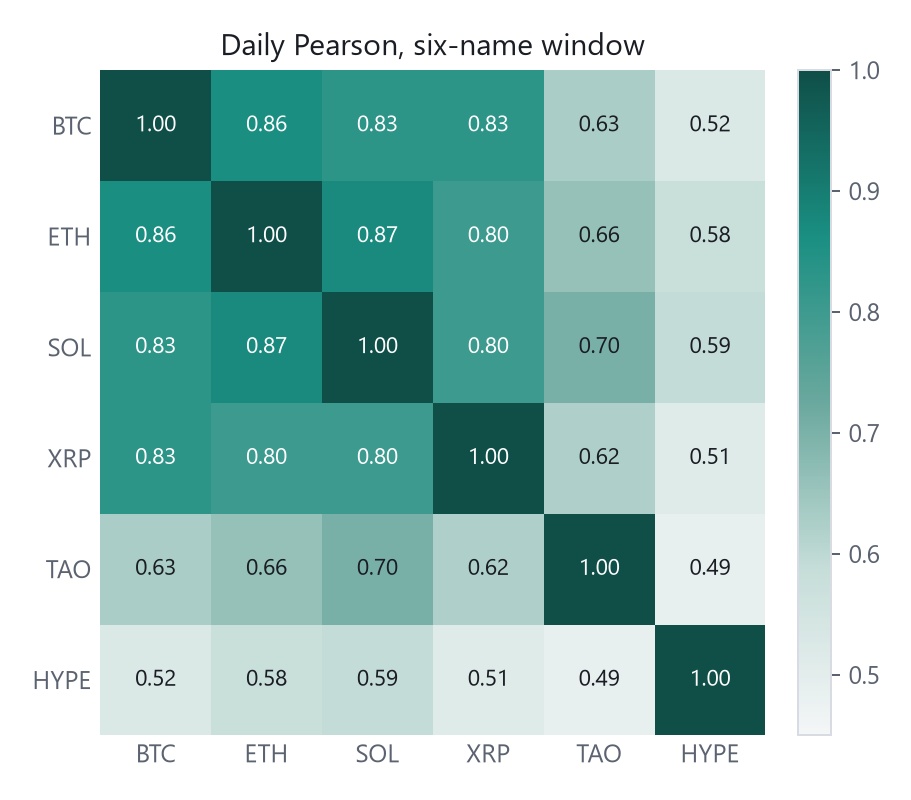
Short common sample. HYPE versus BTC is 0.52. Do not read this as a seven-year relationship.
| Asset | Majors ρ vs BTC | TAO-window ρ | Six-window ρ | Majors β | TAO-window β | Six-window β |
|---|---|---|---|---|---|---|
| ETH | 0.81 | 0.83 | 0.86 | 1.11 | 1.25 | 1.35 |
| SOL | 0.59 | 0.80 | 0.83 | 1.17 | 1.37 | 1.38 |
| XRP | 0.59 | 0.67 | 0.83 | 1.03 | 1.16 | 1.31 |
| TAO | n/a | 0.65 | 0.63 | n/a | 1.47 | 1.40 |
| HYPE | n/a | n/a | 0.52 | n/a | n/a | 1.17 |
Pearson versus BTC and OLS beta versus BTC on daily log returns. Beta 1 means it moves about as much as BTC on this sample; 0.5 means about half the typical BTC move. These are market-path statistics, not a live track record.
On the majors window, Spearman for BTC–ETH is also 0.81, so a handful of crash days is not the Pearson result. XRP’s Spearman versus BTC (0.68) sits above its Pearson (0.59). SOL–BTC is 0.59 on the long window and 0.80 from TAO’s listing — the long number is pulled down by 2020–21 decoupling.
Rolling 60-day Pearson versus BTC
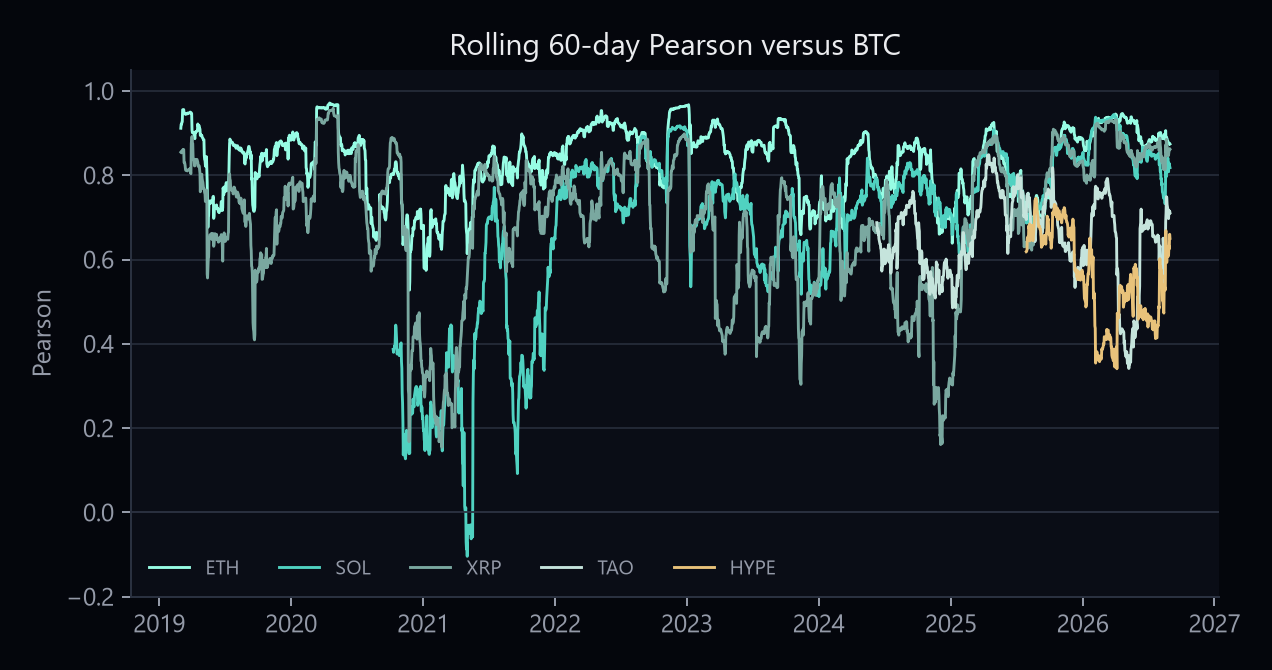
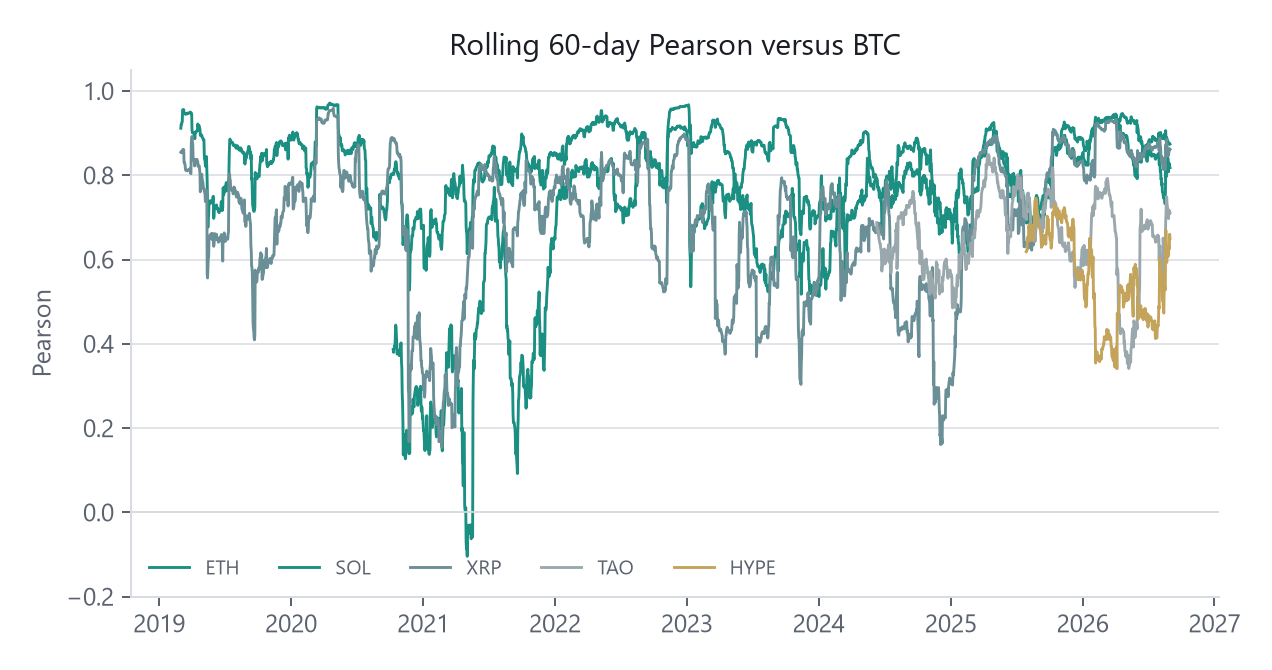
X-axis: end date of each 60-day window. Names enter when they have data.
Pairwise max overlap
In plain English
Each pair uses every day both coins exist, so older pairs (BTC–ETH, 2,799 days) are more reliable than pairs involving HYPE (458 days).
Each pair uses every day both series exist, so TAO–BTC is not forced into the HYPE window.
| Pair | Days | Start | End | Pearson |
|---|---|---|---|---|
| BTC–ETH | 2,799 | 2019-01-02 | 2026-08-31 | 0.83 |
| SOL–TAO | 872 | 2024-04-12 | 2026-08-31 | 0.67 |
| ETH–TAO | 872 | 2024-04-12 | 2026-08-31 | 0.66 |
| ETH–SOL | 2,211 | 2020-08-12 | 2026-08-31 | 0.66 |
| ETH–XRP | 2,799 | 2019-01-02 | 2026-08-31 | 0.65 |
| BTC–TAO | 872 | 2024-04-12 | 2026-08-31 | 0.65 |
| BTC–XRP | 2,799 | 2019-01-02 | 2026-08-31 | 0.62 |
| BTC–SOL | 2,211 | 2020-08-12 | 2026-08-31 | 0.59 |
| SOL–HYPE | 458 | 2025-05-31 | 2026-08-31 | 0.59 |
| ETH–HYPE | 458 | 2025-05-31 | 2026-08-31 | 0.58 |
| BTC–HYPE | 458 | 2025-05-31 | 2026-08-31 | 0.52 |
| XRP–HYPE | 458 | 2025-05-31 | 2026-08-31 | 0.51 |
| SOL–XRP | 2,211 | 2020-08-12 | 2026-08-31 | 0.51 |
| XRP–TAO | 872 | 2024-04-12 | 2026-08-31 | 0.51 |
| TAO–HYPE | 458 | 2025-05-31 | 2026-08-31 | 0.49 |
Hourly check
In plain English
The same question on hourly data, over different and more recent windows than the daily tables, so the two aren't directly comparable. HYPE is still the loosest link to BTC (0.58).
Same-hour log returns. The majors last-12-month slice is the cleaner hourly picture. The six-name HYPE window is short.
Majors, 31 Aug 2025 – 31 Aug 2026 (8,761 hours)
| BTC | ETH | SOL | XRP | |
|---|---|---|---|---|
| BTC | 1.00 | 0.88 | 0.83 | 0.77 |
| ETH | 0.88 | 1.00 | 0.85 | 0.78 |
| SOL | 0.83 | 0.85 | 1.00 | 0.80 |
| XRP | 0.77 | 0.78 | 0.80 | 1.00 |
All six, HYPE window, 31 May 2025 – 31 Aug 2026 (10,992 hours)
| BTC | ETH | SOL | XRP | TAO | HYPE | |
|---|---|---|---|---|---|---|
| BTC | 1.00 | 0.85 | 0.80 | 0.75 | 0.62 | 0.58 |
| ETH | 0.85 | 1.00 | 0.84 | 0.76 | 0.64 | 0.59 |
| SOL | 0.80 | 0.84 | 1.00 | 0.78 | 0.65 | 0.61 |
| XRP | 0.75 | 0.76 | 0.78 | 1.00 | 0.63 | 0.53 |
| TAO | 0.62 | 0.64 | 0.65 | 0.63 | 1.00 | 0.50 |
| HYPE | 0.58 | 0.59 | 0.61 | 0.53 | 0.50 | 1.00 |
HYPE remains the loosest versus BTC on the hour (0.58). Do not read this 15-month futures window as a seven-year fact.
Caveats
Notes are educational. They are not investment advice and they do not recommend trades. Historical or simulated results are not a live track record.
Co-movement is not a pairs trade, not causation, and not Coinbase USD. HYPE is a short Binance futures sample. Young names cannot speak to 2018 or 2022.
Disclaimer
- ΔTrace Labs is a personal portfolio and research project, not a registered fund, asset manager, broker, exchange, advisory business or licensed virtual-asset service provider.
- It does not manage external capital, accept deposits, provide investment advice, sell signals or offer client trading services.
- Named platforms and evaluation programmes, including Propr, Hyperliquid, Lucid Trading and Tradeify, are not employers or formal affiliates.
- Research on this site is educational and is not a recommendation to buy, sell or hold any instrument. Historical or simulated results are not a live track record.
- No returns, assets under management, clients, partnerships, testimonials or performance figures are claimed unless they can be evidenced. Published indicators are listed only when a public URL exists.