 ΔTrace Labs
Educational research note
BTCUSDT weekday, weekend and seasonality
In plain English · the 60-second version
The question. Is Bitcoin traded less on weekends?
The result. Yes. Weekend volume is about 65% of weekday volume (49,836 vs 77,120 BTC a day, 2019–2025), and about 58% in 2022–2025. The lowest year was 2024 at 47%.
Caveats. This is a fact about activity, not price. It doesn't show that avoiding weekends improves any strategy. The month-by-month and seasonality tables use only seven observations per month, so treat them as noise rather than a calendar effect.
Scope. Describes activity on one exchange (Binance, daily bars). It is a liquidity observation, not a test of any strategy.
Bottom line: Weekends are quieter for Bitcoin, about two-thirds of weekday volume and thinner than they used to be. That says nothing about price direction.
Jargon decoder
- Volume
- How much of an asset was traded. High volume = busy, easy to trade; low volume = quiet and thinner.
- Weekend / weekday
- Average weekend volume divided by average weekday volume. 65% = weekends are about two-thirds as busy.
- Seasonality index
- A month's activity relative to a normal month that year. 100 = typical, 125 = 25% busier, 75 = 25% quieter.
- UTC
- One global clock, so times mean the same everywhere. Korea is UTC+9.
Summary
Weekend BTC volume averaged 64.6% of weekday volume on this venue: 49,836 BTC/day versus 77,120 BTC/day. That is a liquidity fact, not a rule about when to trade.
In 2022–2025, weekends averaged 58.4% of weekday activity. The gap is persistent and widened after 2021. It does not establish that avoiding weekends improves any strategy.
Key figures
Evidence
In plain English
The year table shows the gap widening: weekends were about 79% of weekdays in 2019 and about 47–52% in 2024–25. In the seasonality chart 100 is a normal month; March (125) and November (128) look busier, but with only seven years of data a couple of unusual years can create that pattern.
Average daily volume by weekday
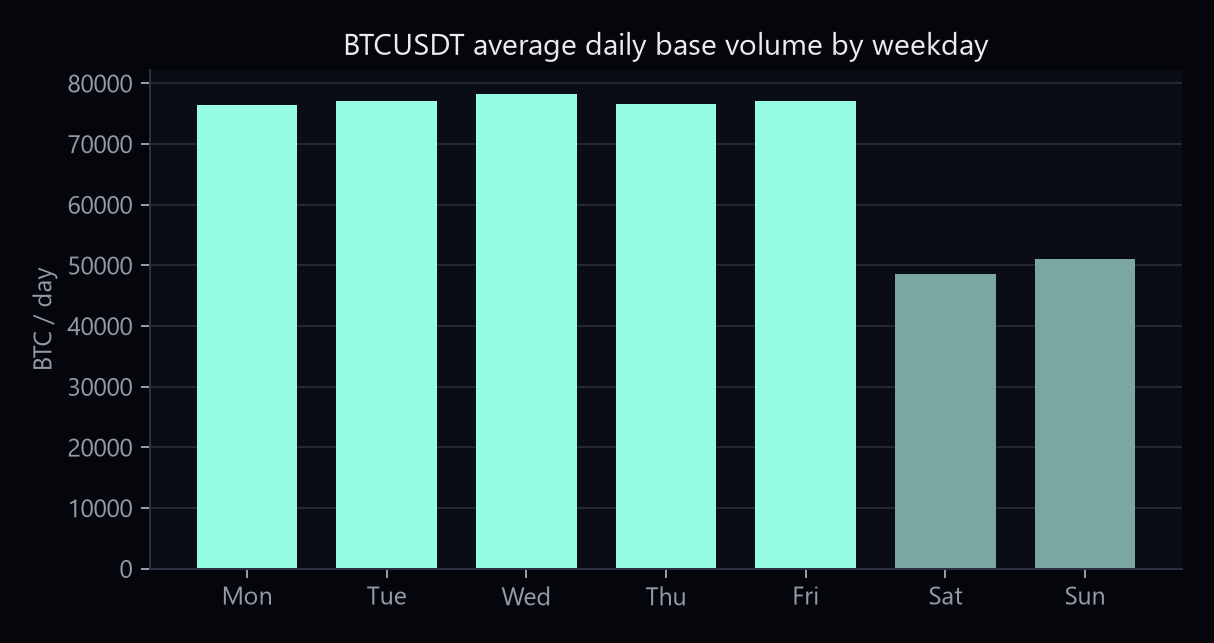
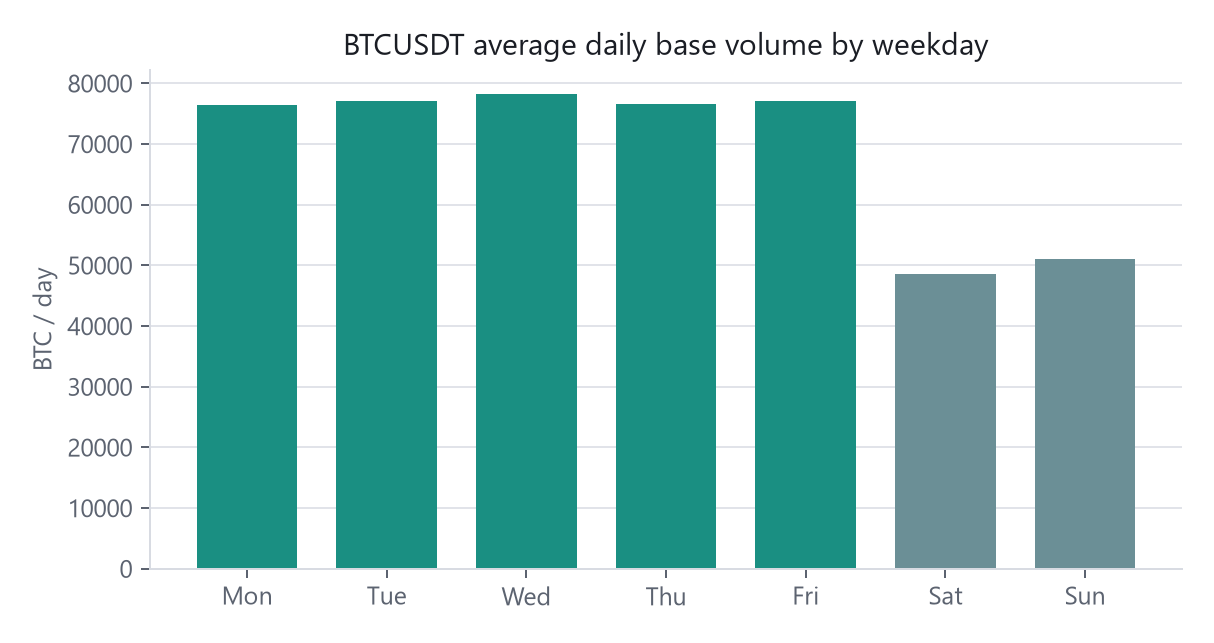
Mean base-asset volume in BTC/day. Source: official Binance Data Collection monthly 1d kline archives, SHA-256 verified. Sample: 1,827 weekday days and 730 weekend days.
| Year | Weekend / weekday | Weekend shortfall |
|---|---|---|
| 2019 | 79.2% | 20.8% |
| 2020 | 71.1% | 28.9% |
| 2021 | 77.9% | 22.1% |
| 2022 | 59.3% | 40.7% |
| 2023 | 61.9% | 38.1% |
| 2024 | 46.8% | 53.2% |
| 2025 | 51.7% | 48.3% |
Calendar month: weekday versus weekend
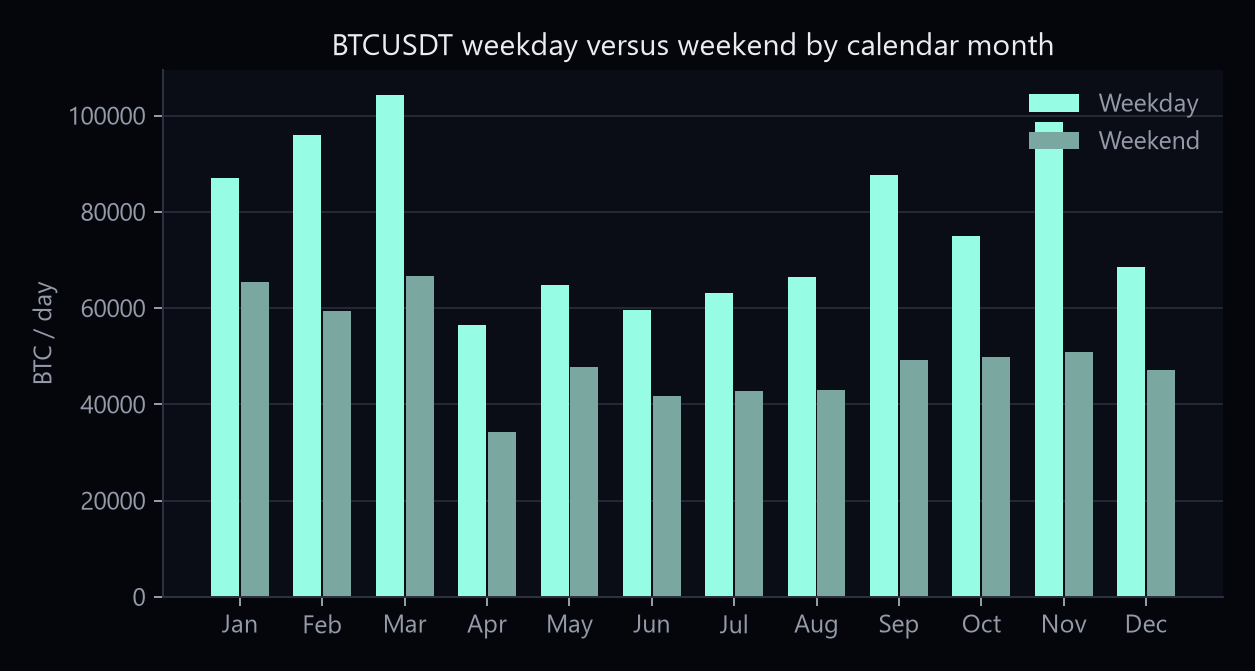
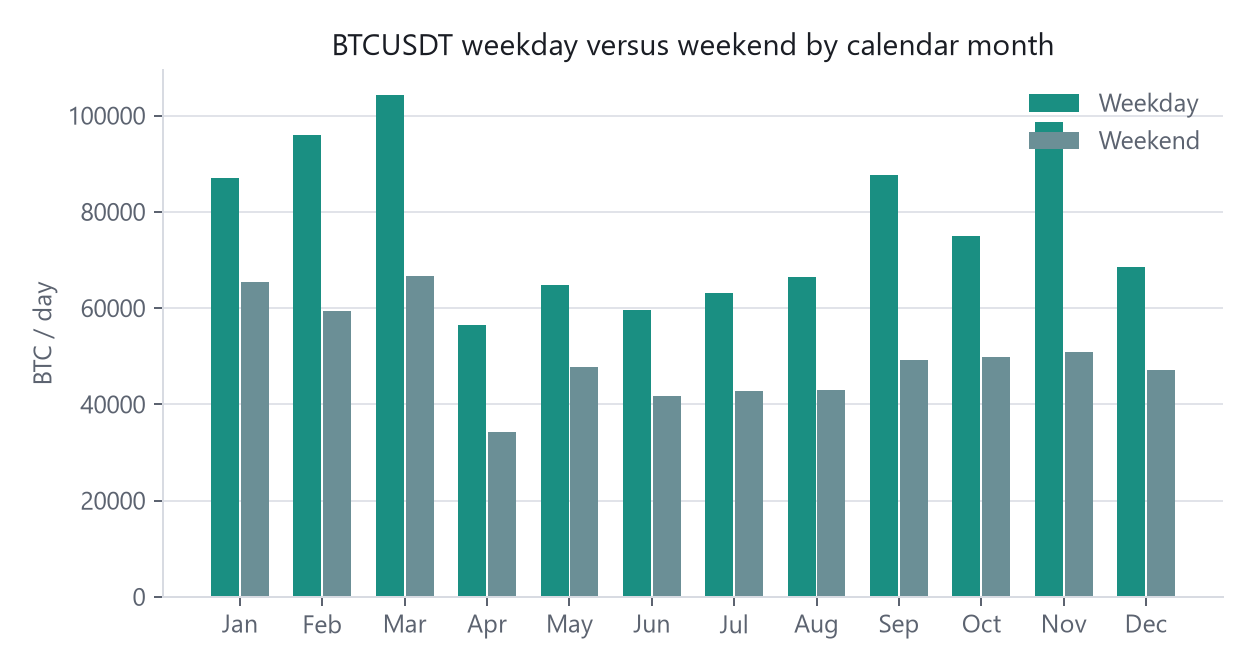
Mean Binance spot BTC volume per day, pooled across complete UTC years 2019–2025.
| Month | Weekday mean BTC/day | Weekend mean BTC/day | Weekend / weekday |
|---|---|---|---|
| January | 86,989 | 65,399 | 75.2% |
| February | 95,882 | 59,361 | 61.9% |
| March | 104,225 | 66,583 | 63.9% |
| April | 56,387 | 34,302 | 60.8% |
| May | 64,771 | 47,702 | 73.6% |
| June | 59,625 | 41,630 | 69.8% |
| July | 63,225 | 42,800 | 67.7% |
| August | 66,388 | 42,933 | 64.7% |
| September | 87,585 | 49,265 | 56.2% |
| October | 75,013 | 49,915 | 66.5% |
| November | 98,693 | 50,894 | 51.6% |
| December | 68,433 | 47,053 | 68.8% |
Smallest relative gap: January (75.2%) and May (73.6%). Largest: November (51.6%) and September (56.2%).
Monthly volume seasonality
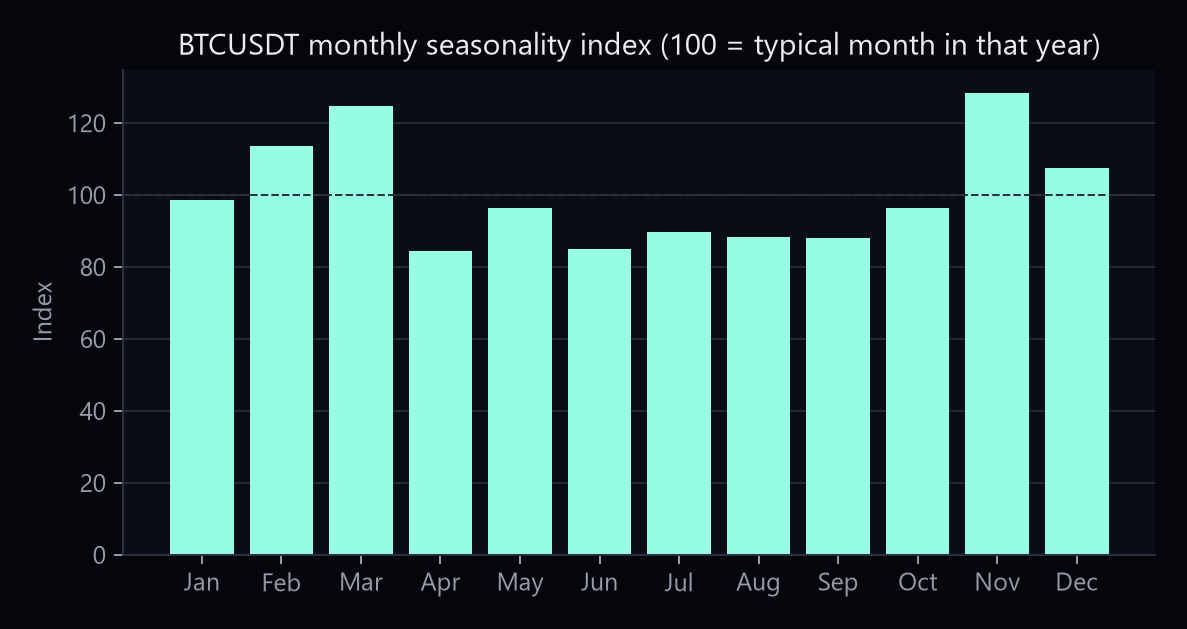
Each month’s average daily USDT turnover is normalized to its own calendar year. An index of 100 equals the typical month for that year.
March (124.8) and November (128.4) are stronger on this normalized measure. April through September are generally weaker. Seven observations per calendar month are not enough to treat this as a dependable calendar effect.
Caveats
Notes are educational. They are not investment advice and they do not recommend trades. Historical or simulated results are not a live track record.
This is one venue, one pair, UTC daily bars. A weekend volume gap is not a test of fees, spreads, slippage, or any strategy’s realized path. Absolute monthly levels also mix different market cycles. SHA-256 verified Binance Vision monthly 1d klines. Sample: 1,827 weekday days and 730 weekend days.
Disclaimer
- ΔTrace Labs is a personal portfolio and research project, not a registered fund, asset manager, broker, exchange, advisory business or licensed virtual-asset service provider.
- It does not manage external capital, accept deposits, provide investment advice, sell signals or offer client trading services.
- Named platforms and evaluation programmes, including Propr, Hyperliquid, Lucid Trading and Tradeify, are not employers or formal affiliates.
- Research on this site is educational and is not a recommendation to buy, sell or hold any instrument. Historical or simulated results are not a live track record.
- No returns, assets under management, clients, partnerships, testimonials or performance figures are claimed unless they can be evidenced. Published indicators are listed only when a public URL exists.