 ΔTrace Labs
Educational research note
Bitcoin versus Korean equities and the dollar
In plain English · the 60-second version
The question. Does Bitcoin move with Korean stocks or with the US dollar?
The result. Barely, on a normal day. The correlation with Korean stocks is 0.12 (weak) and with the dollar index is −0.03 (essentially none).
Caveats. The Korea link has grown (0.50 in 2022, 0.43 in 2025), and on Korea's worst 5% of days since 2020 Bitcoin fell too (average −2.9%), so it is not a crash hedge. The dollar link only shows on extreme days: on big dollar-spike days BTC averaged −0.9%; on big dollar-slump days it averaged +0.3%.
Scope. Based on 3,400+ daily observations. This is a descriptive study, and both comparison series are stand-ins (a US-listed Korea ETF and a rebuilt dollar index).
Bottom line: Bitcoin mostly does its own thing day to day, but in market panics it tends to fall alongside stocks, so it isn't a safe haven.
Jargon decoder
- Correlation (Pearson ρ)
- −1 to +1: how closely two things move together. 0 = unrelated, +1 = lockstep, negative = opposite. Under about 0.2 is weak; above about 0.5 is strong.
- Rolling 90-day
- A correlation recomputed over a moving 90-day window, to see how the relationship changes over time.
- t-stat
- Signal-to-noise. Around 2 or above means the result is unlikely to be pure chance; it says nothing about whether it is large or useful.
- Proxy
- A stand-in for the real thing. USDT stands in for USD; the EWY ETF stands in for the Korean stock market.
- EWY / DXY
- EWY is a US-listed Korea stock ETF used in place of the KOSPI index. DXY is the US dollar index against major currencies (rebuilt here from six currencies).
Summary
Bitcoin is weakly related to Korean equities on ordinary days and essentially unrelated to a synthetic dollar index. Full-sample daily Pearson versus EWY (the KOSPI proxy available on QuantConnect) is 0.124. Versus synthetic DXY it is −0.031.
The weak Korea link is not a crash hedge. On EWY’s worst 5% days BTC still fell, and after 2020 it fell hard with Korea. Correlation with DXY is a tail/liquidity effect, not a stable inverse.
Key figures
Coverage
In plain English
The real KOSPI index and real DXY weren't available, so the study uses stand-ins. That adds some noise, so read the results as 'Bitcoin vs a Korea-stock ETF' and 'vs a rebuilt dollar index'.
BTCUSD Bitfinex daily from 15 Jan 2013. EWY as KOSPI proxy (MSCI Korea ETF; KOSPI itself is not on QuantConnect). Aligned log returns: 3,426 observations to 28 Aug 2026. Synthetic DXY from Oanda QuoteBars with ICE weights: EURUSD −0.576, USDJPY +0.136, GBPUSD −0.119, USDCAD +0.091, USDSEK +0.042, USDCHF +0.036. 4,254 overlapping BTC–DXY observations, 2 Jan 2013 – 30 Aug 2026.
EWY is a USD-listed Korea ETF. It embeds USD/KRW as well as Korean equity risk, trades on US hours rather than KST, and tracks MSCI Korea rather than the KOSPI print. Read this as BTC versus a liquid Korea-equity proxy.
Evidence
In plain English
Reading the tables: near-zero rows (2013–2019) mean no link; the link appears in stress years (2020, 2022, 2025). In 61% of 90-day windows the correlation sat between −0.2 and +0.2, meaning no real relationship most of the time, but the latest reading (+0.37) is unusually high. The lead–lag table shows the link exists only on the same day: neither moves first in a way that helps predict the other.
BTC versus EWY by year
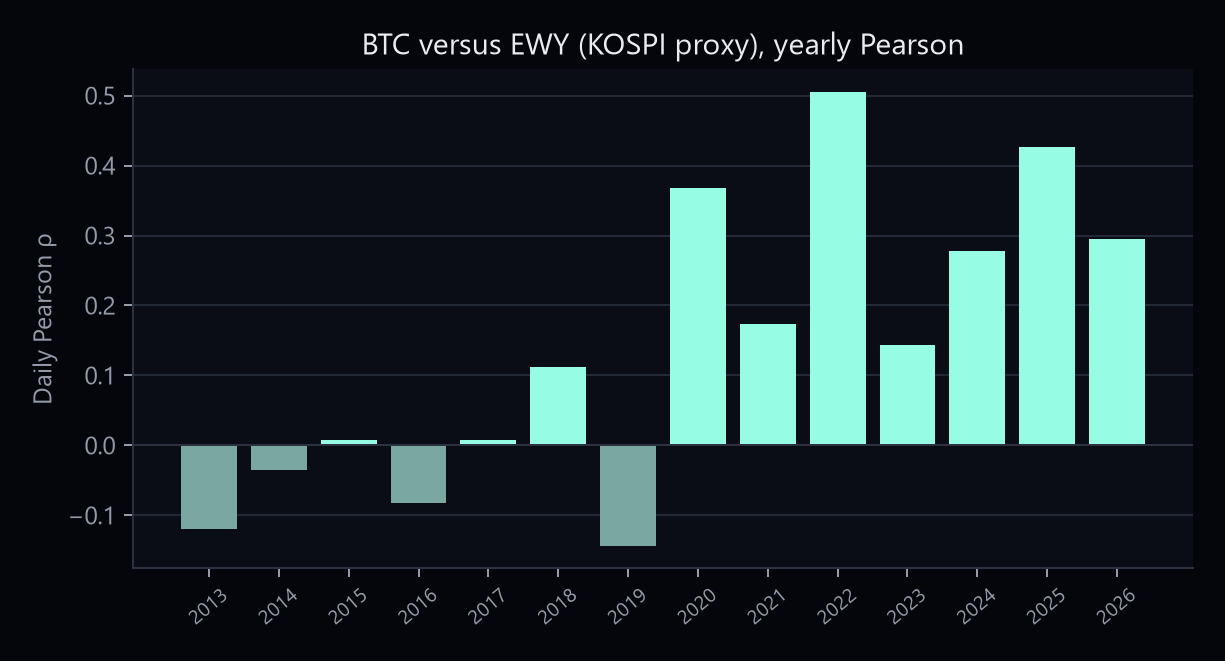
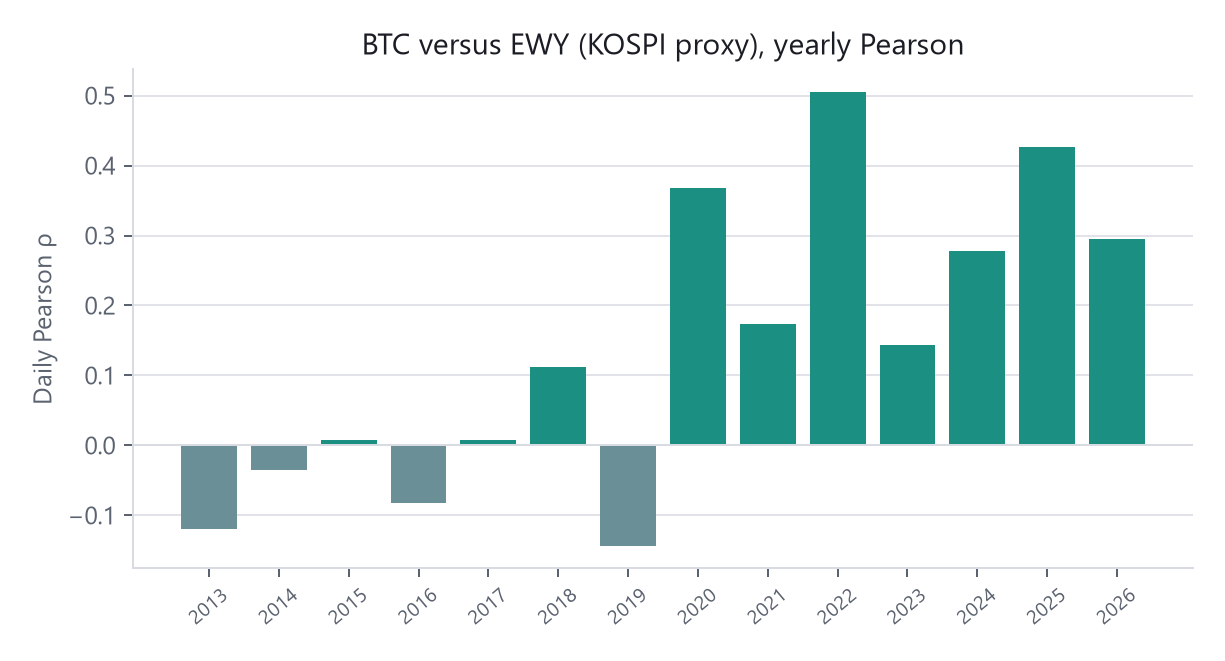
2013–2019 is near zero or negative. 2022 is 0.50. 2025 is 0.43. t-stat on the full sample is 7.29: significant and still economically weak.
| Year | BTC–EWY ρ | BTC–DXY ρ |
|---|---|---|
| 2013 | −0.12 | −0.08 |
| 2014 | −0.04 | −0.03 |
| 2015 | 0.01 | 0.02 |
| 2016 | −0.08 | 0.09 |
| 2017 | 0.01 | 0.00 |
| 2018 | 0.11 | −0.06 |
| 2019 | −0.14 | −0.09 |
| 2020 | 0.37 | −0.19 |
| 2021 | 0.17 | −0.03 |
| 2022 | 0.50 | −0.05 |
| 2023 | 0.14 | 0.06 |
| 2024 | 0.28 | 0.16 |
| 2025 | 0.43 | −0.02 |
| 2026 (partial) | 0.29 | −0.06 |
Rolling 90-day BTC–EWY (3,336 windows):
| Statistic | Value |
|---|---|
| Mean / median | +0.13 / +0.10 |
| 10th / 25th / 75th / 90th | −0.15 / −0.02 / +0.30 / +0.44 |
| Min | −0.31 (19 Sep 2019) |
| Max | +0.64 (14 Jul 2022) |
| Latest | +0.37 (28 Aug 2026) |
| Share above +0.50 | 5.1% |
| Share −0.20 to +0.20 | 60.9% |
| Share below −0.20 | 4.0% |
Lead–lag of BTC versus same-day EWY. Positive lag is BTC from k days earlier. It peaks at lag 0 and is noise elsewhere.
| BTC lag | ρ vs same-day EWY |
|---|---|
| −5 | +0.03 |
| −2 | +0.06 |
| −1 | −0.02 |
| 0 | +0.12 |
| +1 | −0.02 |
| +5 | +0.01 |
Conditional: on EWY’s worst 5% days (avg −3.9%), BTC averaged −1.7% over the full sample. 2013–2019: BTC was up on those days (+0.54% vs +0.35% overall). 2020–2026: BTC averaged −2.9% vs +0.14% overall. Diversification on quiet days; not protection in a crash after 2020.
BTC versus synthetic DXY by year
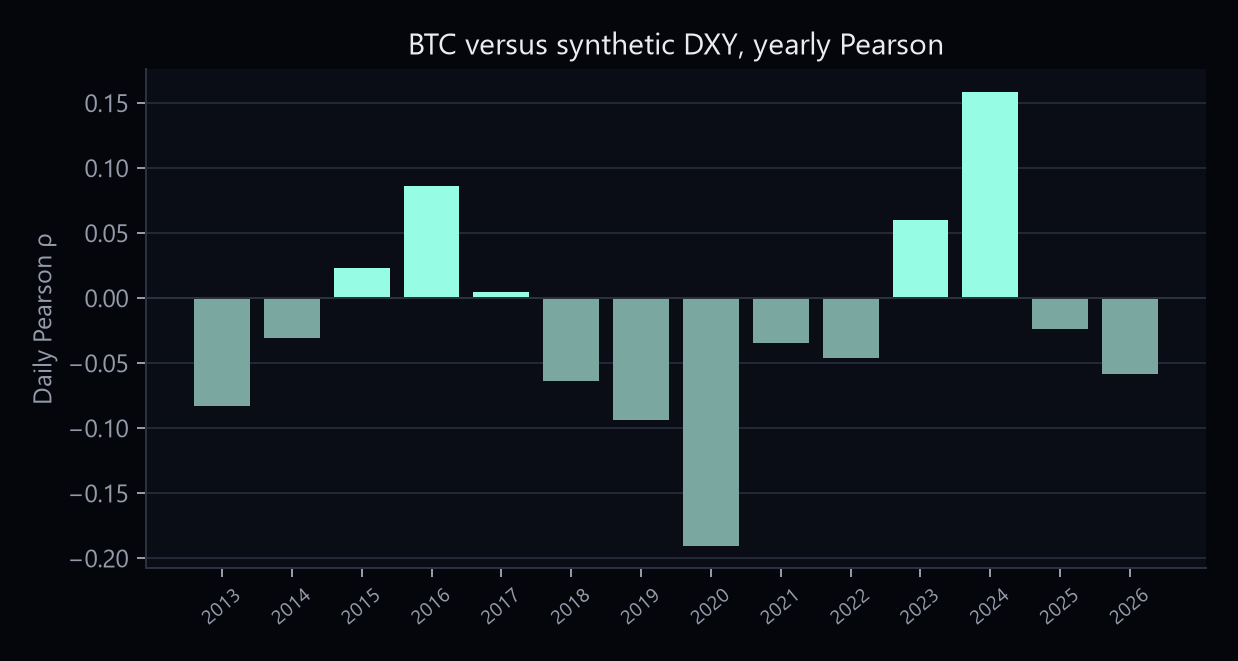
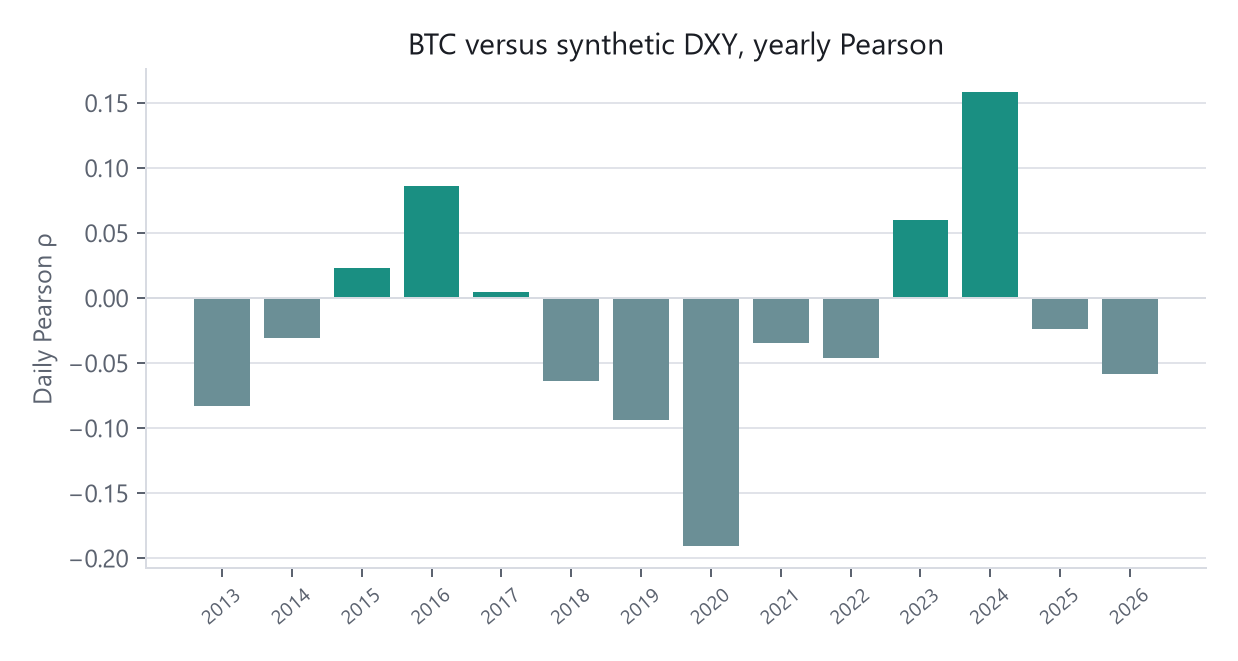
Full-sample −0.031 (t −2.02). Rolling 90-day mean −0.017; only 6.4% of windows sit below −0.2. 2020 is the dollar-stress year (−0.19).
On extreme dollar days the inverse shows up: when the synthetic DXY slumps about 0.61%, BTC averaged +0.34%; when it spikes about 0.62%, BTC averaged −0.90%. That is a tail fact, not a daily trading rule. The first pass at those tails had inverted labels; the numbers above use the corrected read (negative DXY return = weaker dollar).
Caveats
Notes are educational. They are not investment advice and they do not recommend trades. Historical or simulated results are not a live track record.
EWY is a USD-listed Korea ETF, not KOSPI in KRW. DXY is reconstructed from EUR, JPY, GBP, CAD, SEK and CHF weights; the index itself is not on QuantConnect. BTC trades every day; equity and FX aligns drop weekends. This is a QuantConnect notebook, not Binance Vision.
Disclaimer
- ΔTrace Labs is a personal portfolio and research project, not a registered fund, asset manager, broker, exchange, advisory business or licensed virtual-asset service provider.
- It does not manage external capital, accept deposits, provide investment advice, sell signals or offer client trading services.
- Named platforms and evaluation programmes, including Propr, Hyperliquid, Lucid Trading and Tradeify, are not employers or formal affiliates.
- Research on this site is educational and is not a recommendation to buy, sell or hold any instrument. Historical or simulated results are not a live track record.
- No returns, assets under management, clients, partnerships, testimonials or performance figures are claimed unless they can be evidenced. Published indicators are listed only when a public URL exists.